
AC Repair Market in Houston TX — When 10,033 Reviews Don't Buy #1
Houston has a 10,033-review franchise at #2, an 8,219-review operator outside the top 3, and a 60-year company with just 371 reviews still in the map pack. The public data reveals exactly what wins AC repair calls in this market — and review count alone is not it.

HVAC Membership Pricing in 2026: What to Charge for Maintenance Agreements
HVAC maintenance agreements run $150-$500/yr nationally, with most healthy operations pricing $200-$350. The agreement itself is rarely a profit center — the return shows up in repair pipeline, replacement conversion, and retention. Tier structure, modeled per-agreement margin math, and how to price for your market.

HVAC Callback Rate Benchmarks: What Percentage of Jobs Actually Come Back
Industry-typical HVAC callback rates run 1-2% at top shops, 3-5% at acceptable, 8%+ at broken-process shops. The harder problem is definition — the same operation can look like 1.5% or 8% depending on what you count. Breakdown of every callback type, modeled cost per callback, and how top shops track and reduce them.

ServiceTitan vs. Housecall Pro vs. FieldEdge: The Real Cost Comparison
Housecall Pro publishes pricing. ServiceTitan and FieldEdge do not. The first costs $59-$149/mo for small teams. The second runs an estimated $125-$398/user/mo plus $5K-$25K to implement. Honest TCO at 3, 8, and 20 technicians, plus the hidden costs.

HVAC Financing Attach Rate: GoodLeap vs. Wisetack vs. Synchrony Compared
Financing on a $10K HVAC replacement can lift close rate from 30% to 60%+, but the dealer fee comes straight off revenue, not just margin. Synchrony, GoodLeap, and Wisetack each serve different credit tiers and charge differently. Here is the structural comparison and the modeled dealer-fee math.

How Much to Pay HVAC Technicians in 2026: Pay Plans That Don't Bleed Margin
BLS puts the median HVAC tech wage at $27.51/hr and the 75th percentile above $35/hr. The harder question is structure — hourly, spiff, commission, or revenue share. Each rewards different tech behavior and bleeds margin in different ways. Here is the modeled math and how to spot misalignment.
Average HVAC Ticket Size by Job Type: Service, Repair, Maintenance, Replacement
HVAC ticket size depends on job type. Service calls run $75-$200, repairs $150-$650, maintenance $70-$200, replacements $5,000-$15,000+. Here is the full breakdown by job type with public-source ranges and why blended average ticket is the wrong metric to track.
Get every new market breakdown in your inbox.
By subscribing, you agree to receive new research and occasional updates from Built on Tenth. Unsubscribe anytime. Privacy Policy →
AC Repair Market in Orlando FL — Where 13,896 Reviews Couldn't Buy #1
Orlando is the Florida market that proves review volume is no longer the dominant ranking signal. Frank Gay Services holds 13,896 reviews — 6.5x its nearest competitor — and still sits at #2 behind a 2,159-review independent. We pulled live map pack data on seven Orlando operators to break down what's actually driving visibility now, and how Apex Service Partners' founding acquisition reshapes the local landscape.

Google's April 2026 Reviews Crackdown: The HVAC Operator's Action Plan
On April 16-17, 2026, Google quietly rewrote the Google Business Profile rules. Asking customers to mention your tech by name is now banned. Staff review quotas are banned. Gemini AI moderates reviews before publish. Public warning banners are live. Here is the HVAC operator action plan.

HVAC AI Answering Service vs. Live CSR: What the Math Actually Says
A loaded HVAC CSR runs $58K-$65K per year. An AI receptionist runs $50-$800 per month. The cost gap is real, but cost is not what decides this question — booking rate is. Here is the honest math, the capability tradeoffs, and the hybrid model that usually wins.

AC Repair Market in Atlanta GA — Why ITP and OTP Are Two Different Markets
Atlanta is the largest HVAC market in the Southeast — and the I-285 perimeter splits it into two distinct competitive markets. We pulled public data on seven of the most visible Atlanta AC repair operators to see who holds the map pack ITP vs. OTP, what signals they lead with, and where smaller operators are winning the calls metro incumbents leave on the table.

AC Repair Market in Dallas TX — Why Multi-Trade Operators Own the Map Pack
Dallas-Fort Worth is the fourth-largest HVAC market in the country and one of the most multi-trade-dominated map packs we audit. Public data on seven of the most visible Dallas AC repair operators shows why HVAC-only operators are losing the broad-metro query, where the submarket entry points actually are, and what's separating Baker Brothers and the Service Experts franchises from the rest.
AC Repair Market in Denver CO — The Only Market Where Heating Outsells Cooling
Denver is the only non-Sun-Belt market in this series — and the structural differences matter. Public data on seven of the most visible Denver HVAC operators shows how a heating-dominant, altitude-affected, Xcel-rebate-driven market reshapes the competitive playbook from what works in Phoenix or Houston.

AC Repair Market in Las Vegas NV — The Property Manager Channel Most Operators Miss
Las Vegas combines Phoenix-level heat with a rooftop-package-unit equipment mix and a property-manager-heavy buyer base no other Sun Belt market replicates at scale. Public data on seven of the most visible Las Vegas AC repair operators shows who holds the map pack, what signals are winning, and why the property-management channel is the most underclaimed positioning in the metro.
AC Repair Market in Tampa FL — How Salt Air Shrinks Every Sales Cycle
Tampa Bay is a market shaped by salt air, hurricanes, and snowbird seasonality. Salt corrosion shortens equipment lifespan an estimated 20-30% versus inland markets — which compresses every sales cycle and shifts the revenue mix toward replacement. Public data on seven of the most visible Tampa AC repair operators shows who holds the map pack, what signals they lead with, and how a short equipment lifespan reshapes the entire competitive playbook.
AC Repair Market in Phoenix AZ — The 32,766-Review Gap That Defines the Market
Phoenix averages 100+ days above 100°F per year and runs the most review-saturated HVAC map pack in the country. The visible top operator carries 32,766 reviews; the bottom of the visible set runs 2,414. Public data on the top 7 operators shows who holds the map pack, what's separating them, and what Phoenix HVAC owners competing in this market should fix first.

HVAC Benchmarks 2026 — The 8 Key Performance Indicators Every Owner Should Know
Eight numbers that tell you whether your HVAC business is performing or just busy. From revenue per technician to map pack position, here is where each benchmark sits and what it signals.
HVAC Close Rate Benchmarks — Service Calls, Estimates, and Replacements
A tune-up close rate of 98% and a replacement close rate of 35% can both be true at the same company. One looks fine. The other is leaving 50-65% of replacement revenue on the table. Most owners track one blended number and miss both signals.

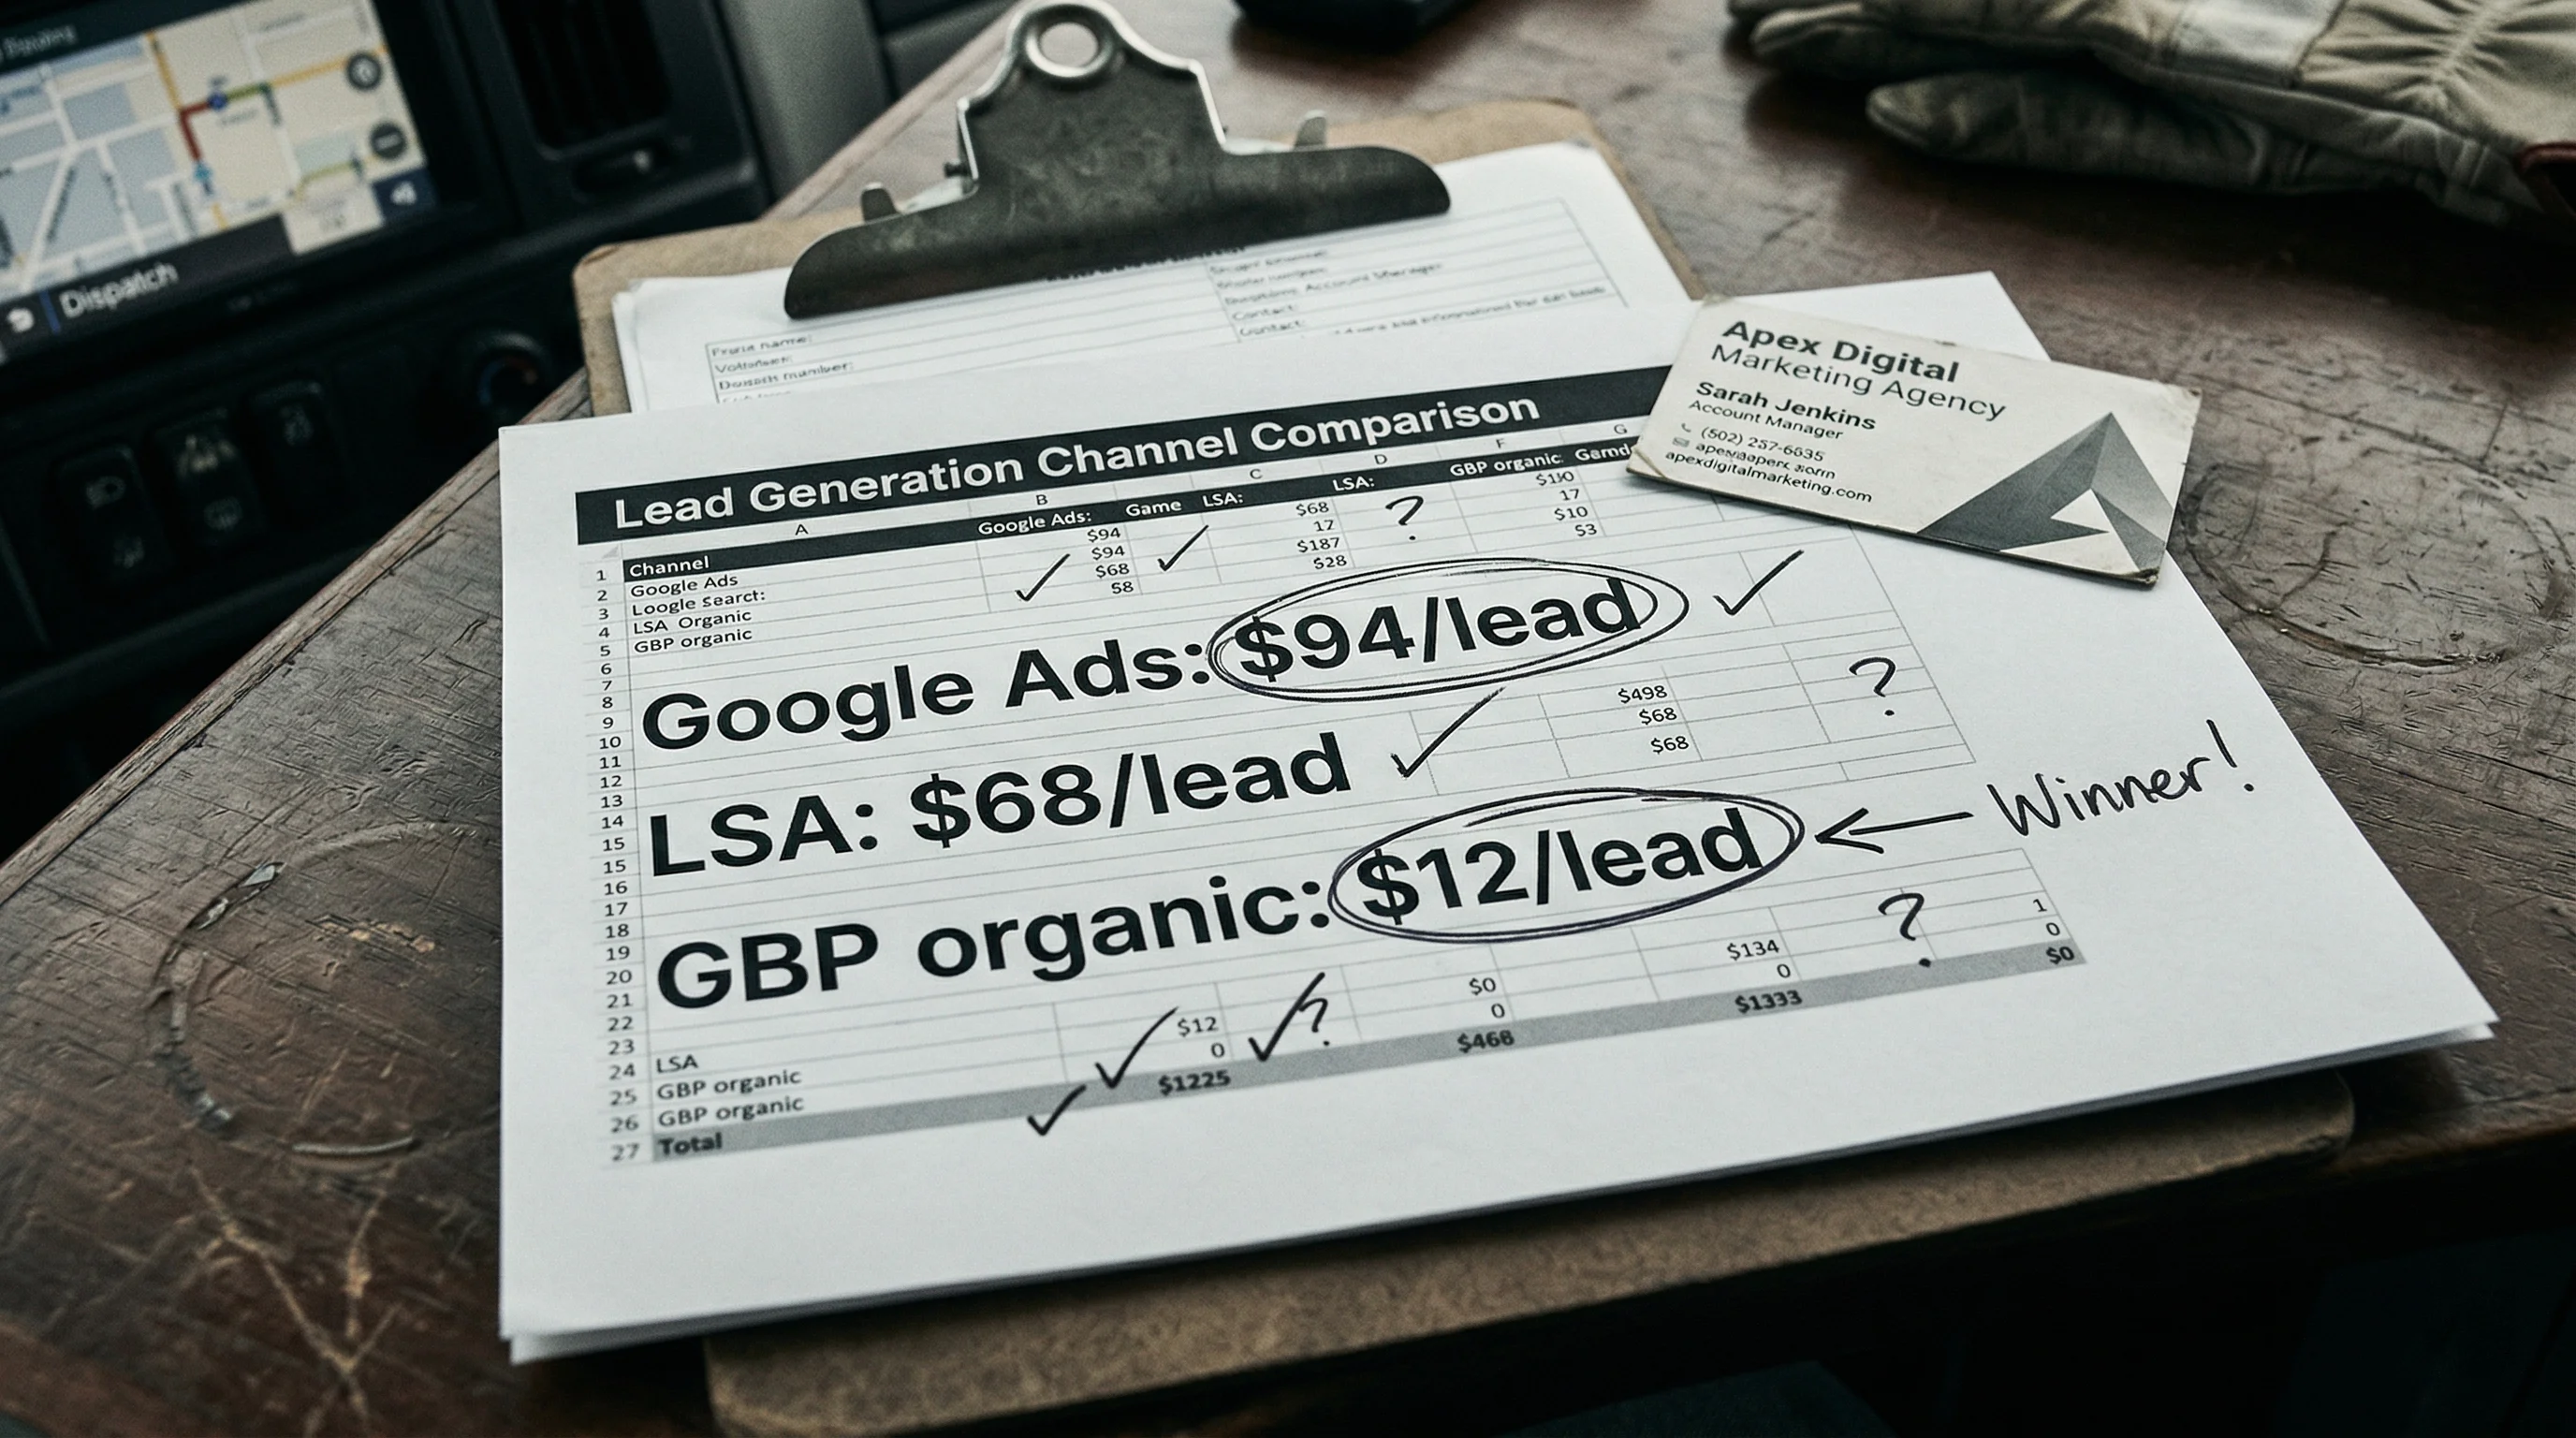
HVAC Cost Per Booked Job by Channel: Google Ads, LSA, GBP, and Organic Compared
Most HVAC owners track cost per lead. Cost per booked job is the number that actually matters. The same $10,000 monthly marketing spend produces very different economics depending on whether it is going into paid search, Local Service Ads, Google Business Profile optimization, or organic content. Here is the comparison by booked-job economics.

HVAC Dispatch Efficiency: How Windshield Time Kills Revenue Per Truck
Your HVAC techs spend 28% of their day driving. At $84.40 per hour in truck operating cost, that windshield time is not a scheduling nuisance. It is a revenue leak. Here is what it costs across a real fleet and which dispatch levers actually close the gap.

HVAC Google Map Pack Ranking: What the Top 3 in Your Market Actually Look Like
The map pack captures 42% of all clicks on a local HVAC search. Position 1 captures the majority of those. Position 4 captures almost none. Here is what the top 3 HVAC companies in a competitive market actually have built, and what it takes to get there.
HVAC Google Reviews: How Many You Need and Why Review Velocity Matters
The average HVAC company has 17 Google reviews. The companies holding map pack positions in competitive markets have 150 to 400+. The gap is not just a count problem. Google weights velocity and recency heavily. A company with 500 reviews and no new ones in 90 days often loses ground to one with 90 reviews coming in at 20 per month.

HVAC Maintenance Agreement Attach Rate Benchmarks by Technician and Call Type
A strong HVAC service agreement program attaches on 30 to 50% of eligible calls. Most companies are running well below that. The gap shows up in revenue per truck, slow-season call volume, and lifetime customer value. Here is how to benchmark your attach rate and which levers move it.

HVAC Net Profit Margin Benchmarks: What Healthy Profitability Actually Looks Like
A $3M HVAC company at 4% net profit makes $120K. A $2.2M company at 14% net makes $308K. Revenue growth without margin discipline produces more work for less money. Here are the benchmarks, what compresses margins in HVAC, and how to tell whether your market is part of the problem.

HVAC Replacement Estimate Win Rate Benchmarks and What Moves Them
Most HVAC replacement estimates do not close. A 35% win rate is not a failure. It is the industry average. The top performers close 50 to 55% of their replacement quotes. Here is what separates them, and how to tell whether your win rate is a follow-up problem, a financing problem, or a market positioning problem.

HVAC Revenue Per Call: What One More Answered and Booked Call Is Actually Worth
90% of HVAC revenue flows through the phone. Every unanswered call is not a missed contact. It is a specific dollar figure going somewhere else. Here is how to calculate your revenue per inbound call and where the answer rate and booking rate math intersects to produce or destroy that number.

The Four Numbers Every HVAC Owner Should Know Before Spending on Marketing
Most HVAC owners spend on marketing without knowing four numbers that determine if any of it is working. Here is what they are and how to pull them today.

How to Audit Your ServiceTitan ROI Before You Renew
Most operators renew ServiceTitan on autopilot. Here is the three-number audit that tells you if it is actually earning its cost.

How to Evaluate an HVAC Marketing Agency: The 7 Numbers They Should Be Reporting
Most HVAC owners sign agency contracts and spend 12 months guessing whether it is working. The problem is not measurement difficulty. It is measuring the wrong things. Here is the evaluation framework, the 7 numbers a legitimate agency should report every month, and what weak answers tell you before you spend another dollar.

Cost Per Lead Is a Vanity Metric. Here's the Number That Actually Tells You If Your Marketing Is Working.
A $35 lead that books at 20% costs $175 per booked job. A $90 lead that books at 65% costs $138 per booked job. The cheaper lead is more expensive. Cost per lead hides this. Cost per booked job reveals it.

Google Business Profile Audit for HVAC Companies: A 35-Point Scoring Framework
The map pack generates the highest-intent leads in HVAC at zero marginal cost per call once position is established. Most HVAC companies set up their profile once and leave it. Here is the full 35-point audit framework and where your profile is most likely giving ground to competitors who have not checked theirs in months either.

HVAC Estimate Follow-Up: The Unsold Revenue Your Outbox Is Sitting On
Most HVAC estimates that go cold are not lost to a competitor. They are lost to inertia. The homeowner expected you to follow up. When you didn't, they either called someone who did or let the decision sit. Here is what your cold estimate backlog is worth and how to recover it systematically.

HVAC Marketing Agency Report Card: How to Audit the Agency You Already Have
Your HVAC marketing agency sends a report every month. It shows impressions, clicks, and cost per lead. It does not show how many of those leads became booked jobs. That gap is not an accident. Here is how to audit the agency you already have and what legitimate accountability actually looks like.

HVAC Website Conversion Rate: Industry Benchmarks and What Actually Moves the Number
The average HVAC website converts 2 to 5% of visitors. Well-optimized sites hit 6 to 10%. Emergency service pages convert higher still. On 500 monthly visitors, the difference between a 3% and 7% conversion rate is 20 additional calls per month from traffic you already paid for.
Revenue Per Technician: The Number That Tells You Whether Your HVAC Business Is Scaling or Just Getting Bigger
A 10-person HVAC company doing $1.8M and one doing $2.9M are not in different markets. They're running different operations. Revenue per tech is the number that shows you which one you are -- and where the gap comes from.

The True Cost of a Missed Call: Why Most Contractors Underestimate It by Half
Home services businesses miss around 27% of inbound calls. 85% of those callers never try again. Most owners guess this costs them $20K to $30K a year. The actual math usually produces a number twice that size.
HVAC Cost Per Lead by Channel in 2026: Google Ads, LSAs, GBP, Angi, and Facebook
HVAC lead costs vary massively by channel. Some sources look cheap and book poorly. Others look expensive and print jobs. Here's the 2026 cost-per-lead and cost-per-booked-job breakdown across every major channel.

HVAC Flat-Rate Pricing: Why Most Companies Undercharge Service Calls
When HVAC techs quote from memory, margins drift and average ticket gets crushed. Here's how flat-rate pricing changes revenue per truck, pricing consistency, and close rate -- and what to actually watch when building a price book.

The Follow-Up Sequence That Moved a 15% Close Rate to 40%
Same prices. Same market. Same estimators. The only thing that changed was what happened after the estimate was sent. Here's the 4-touch sequence and the word-for-word scripts.

How HVAC Service Agreements Add $200K to Your Annual Revenue
Most HVAC companies have a service agreement program that produces almost nothing. The ones that run it right add $150K to $300K in recurring revenue and fill their slow season dispatch board without buying a single extra lead.

How to Set Up Google Local Service Ads for HVAC Companies (And Actually Get Jobs From Them)
LSAs sit above Google Ads and the map pack and charge per lead, not per click. For HVAC companies with 30+ reviews and a fast answer rate, they produce the lowest cost per booked job of any paid channel. Here is the full setup process, what moves your ranking once you are live, and when LSA is not actually your bottleneck.
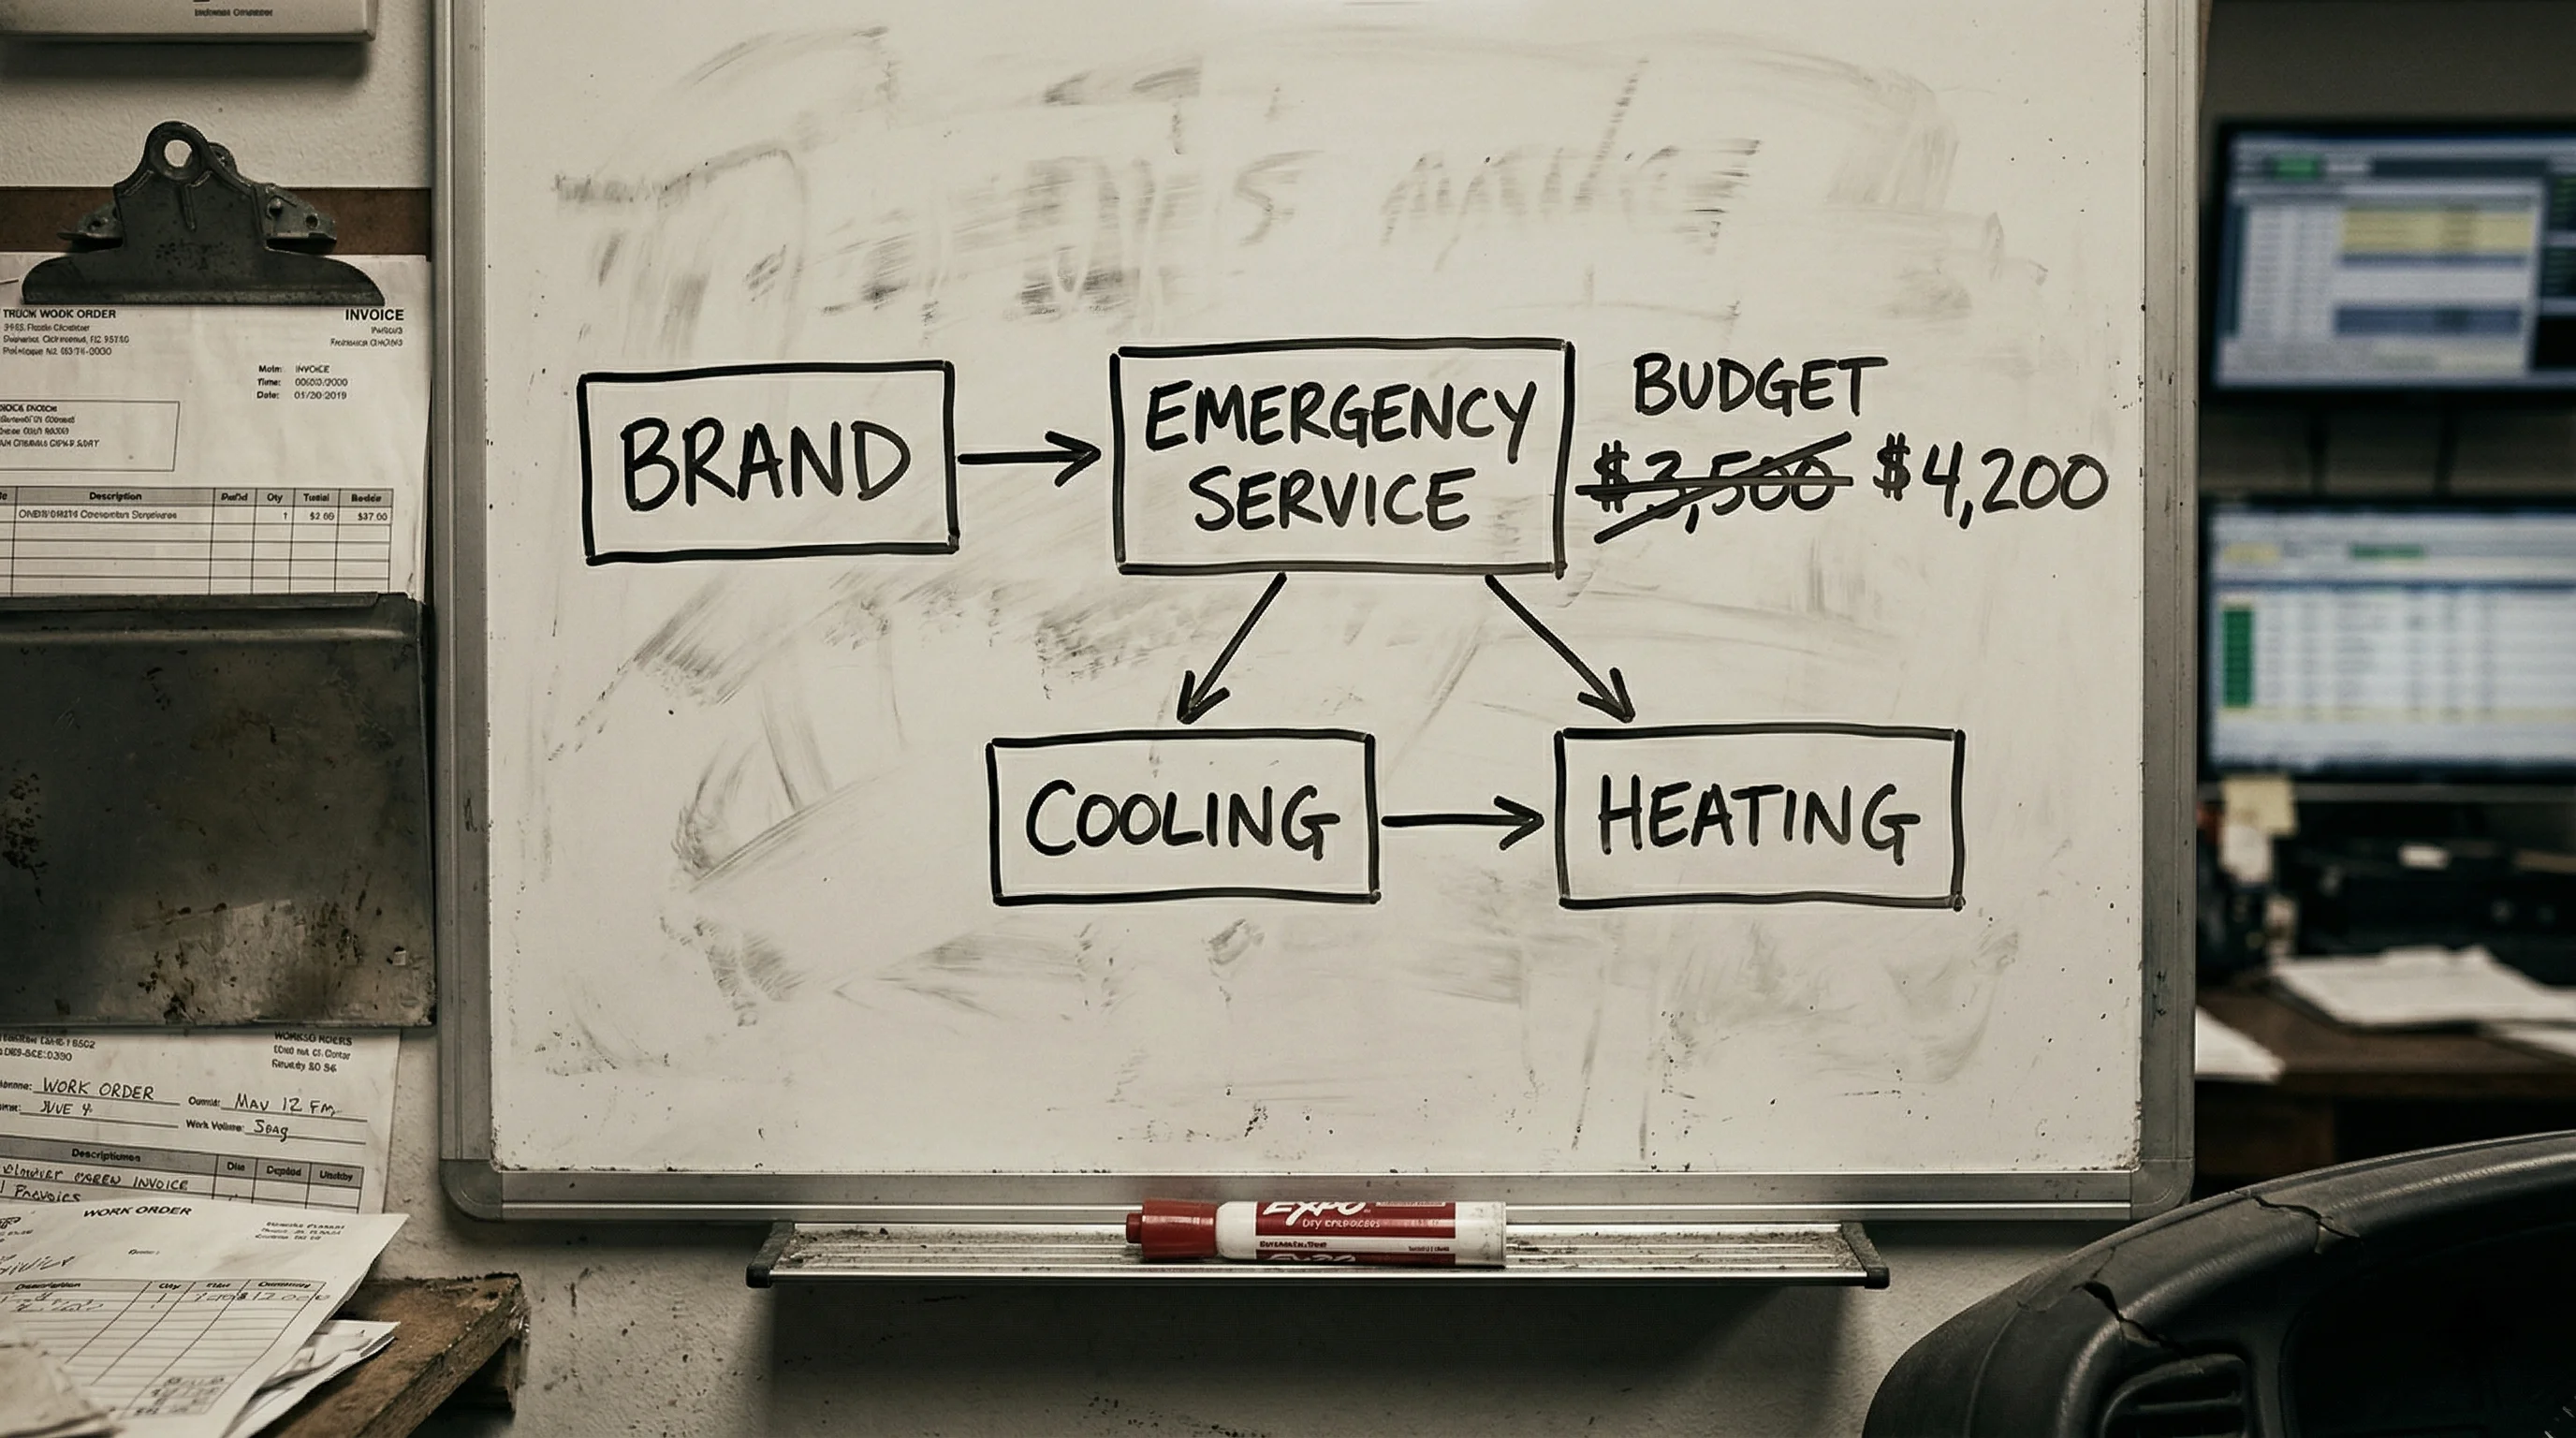
Why Your Google Ads Campaign Structure Is Costing You $80 Per Lead More Than It Should
General HVAC campaigns average $198 per lead. Heating repair campaigns average $144. The difference isn't the market or the budget -- it's campaign structure. Here's exactly what to change and how to tell if your agency has already done it.

How Much Revenue Should Each of Your HVAC Trucks Be Generating?
A top-quartile HVAC truck generates $180K-$280K per year. A bottom-quartile truck generates $80K-$120K. Same technician hours, same market. The gap is almost never about effort -- it's about average ticket, jobs per day, and what happens on every call.

HVAC CSR Booking Rate Benchmarks: What Good Phone Performance Actually Looks Like
The HVAC industry average booking rate is 42%. Top CSR teams hit 62 to 70%. At 300 calls per month and a $1,800 average ticket, the gap between those two numbers is over $1M per year. Here is what healthy phone performance looks like by call type and where the leak usually hides.

How Much Should an HVAC Company Spend on Marketing in 2026?
Most owners are spending $8K to $15K/month without knowing their cost per booked job. Here's the actual math, benchmarks, a 5-step budget formula, and the three places HVAC companies silently leak marketing budget.

I Analyzed a $3M HVAC Company's Entire Online Presence. Here's What I Found.
Strong reviews. Decent website. Running Google Ads. And still leaving an estimated $340,000/year on the table. Here's the full teardown, gap by gap.
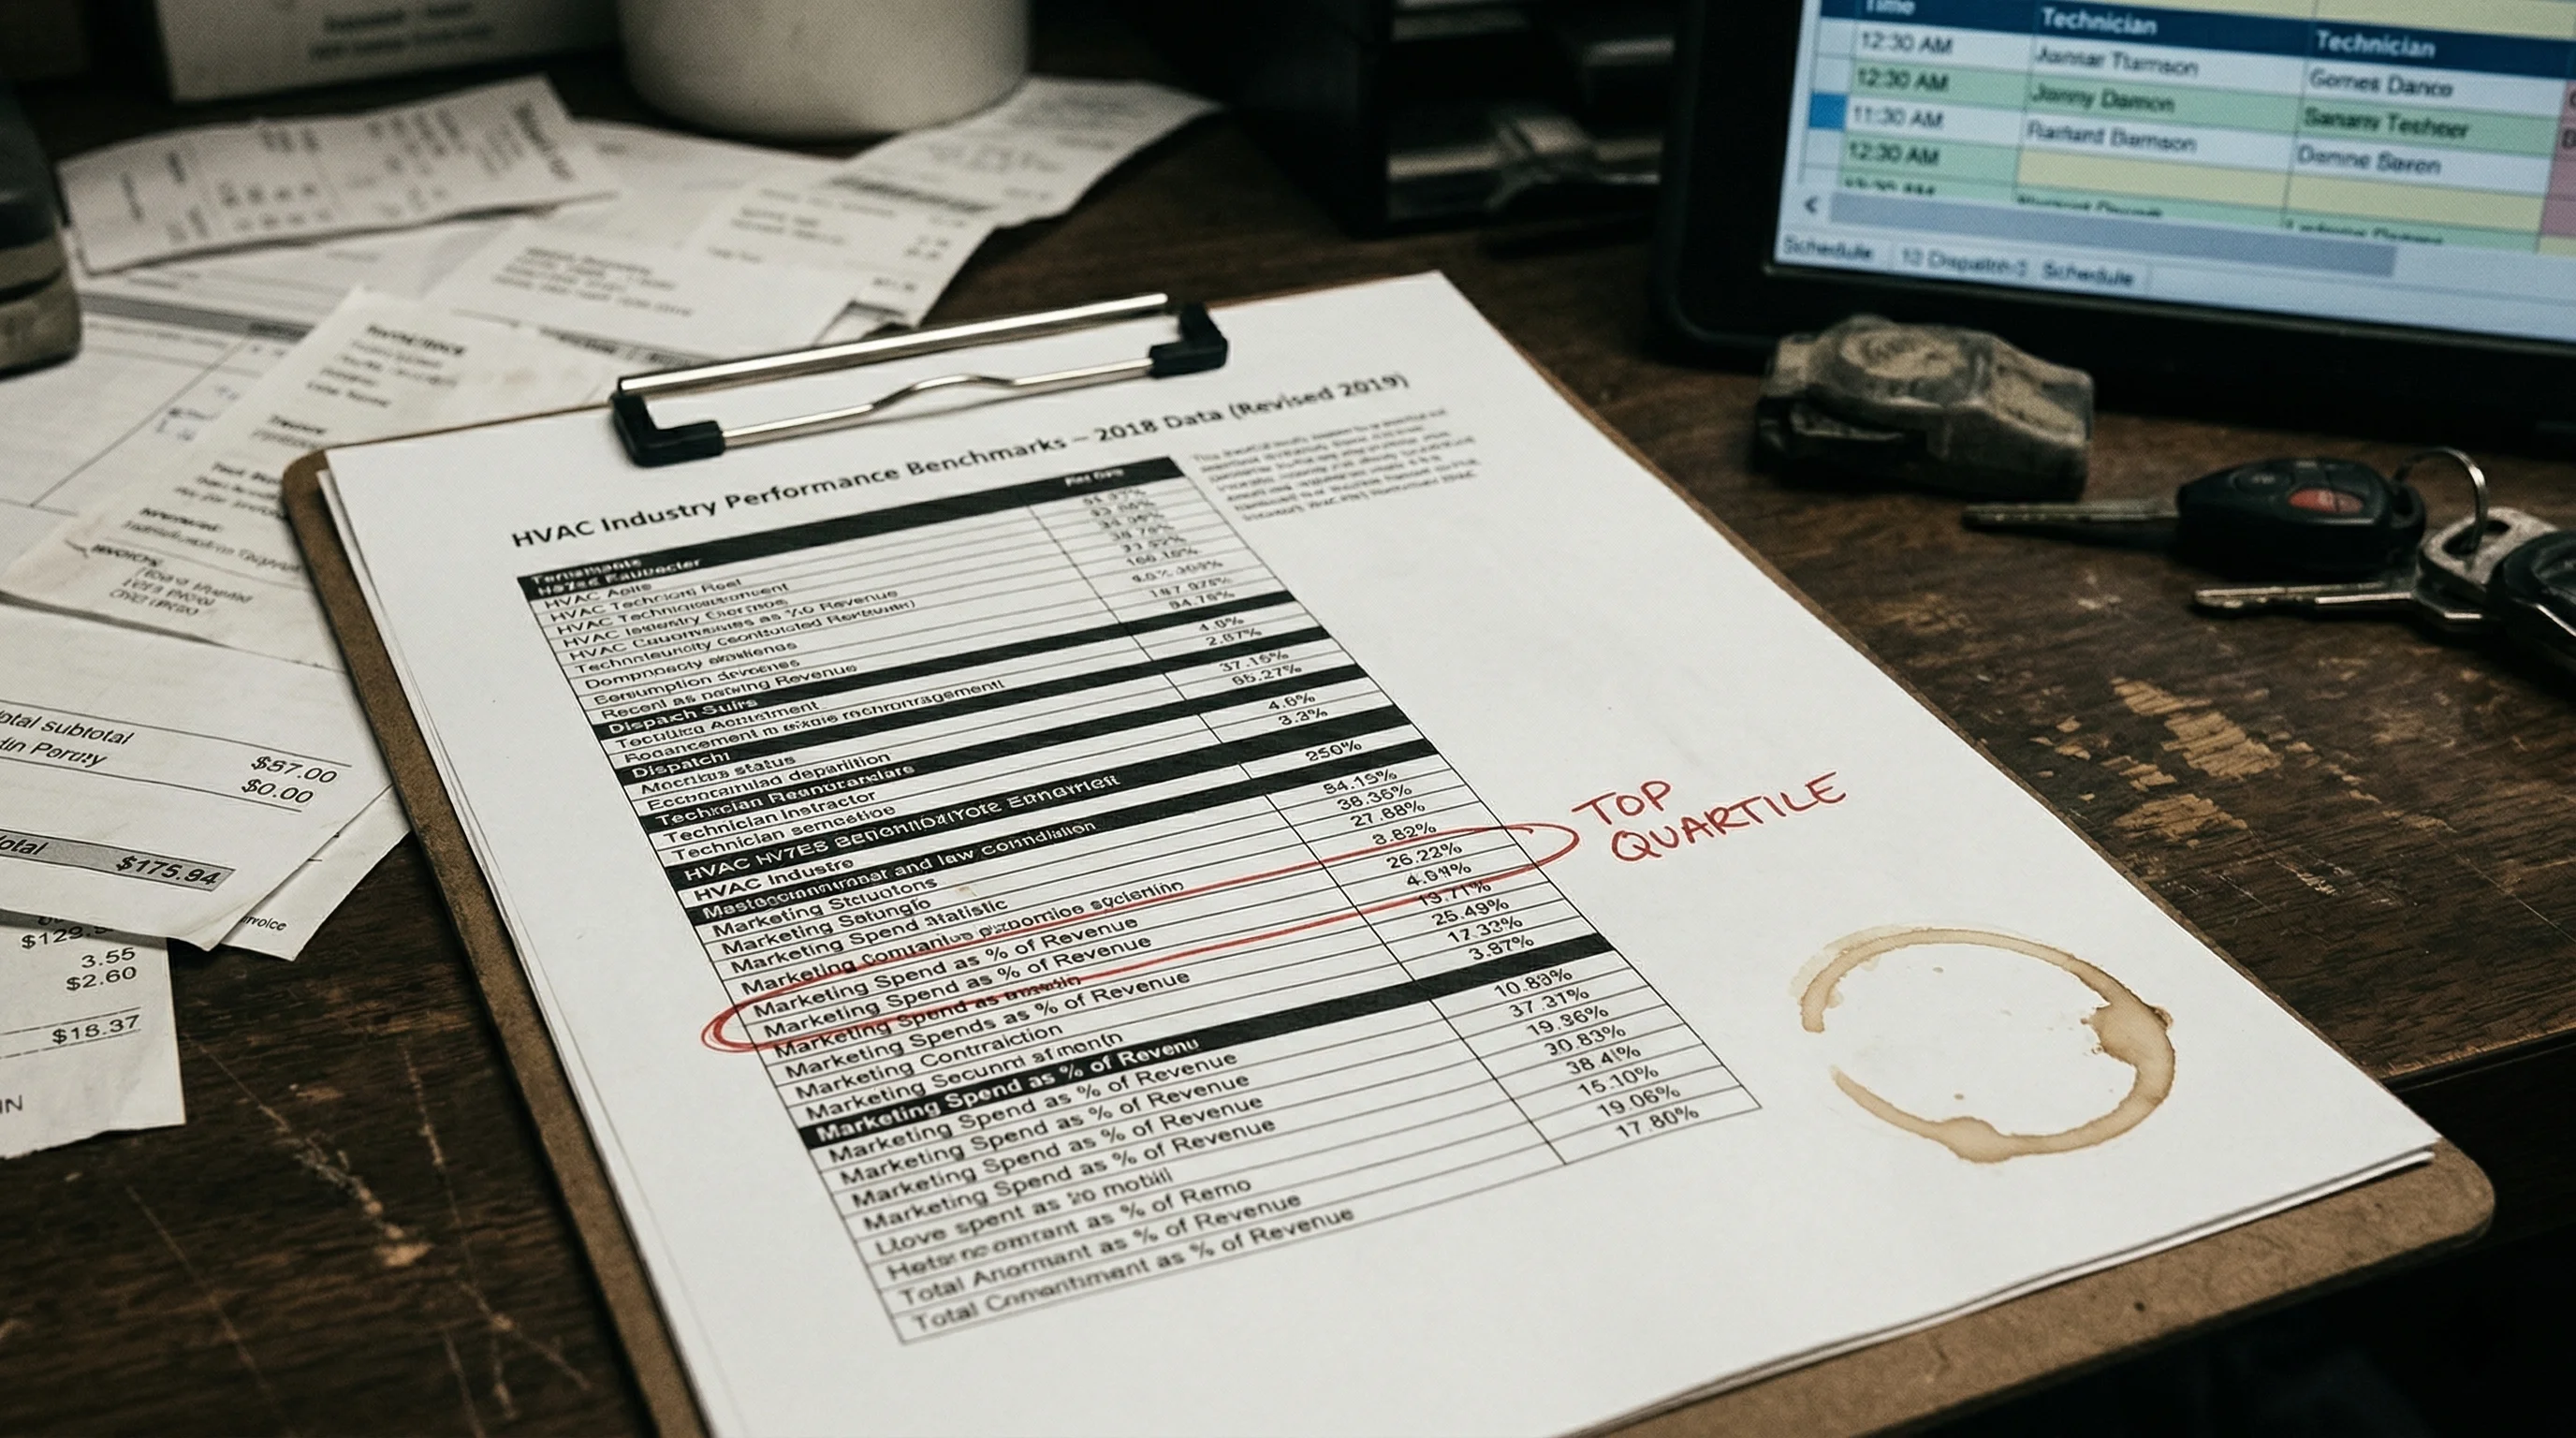
HVAC Marketing Benchmarks 2026: What Top Performers Actually Spend
Top-performing HVAC companies don't outspend the competition. They outmeasure it. Here's what the data from 300+ companies shows about where the real gap lives.