AUDITOR’S OVERVIEW
”Average ticket size” is the single most misused number in HVAC operations. Owners quote it in pitch decks, marketing-agency reports use it to justify spend, and operators benchmark against industry “averages” that were calculated against an entirely different mix of work. The number is not wrong — the framing is.
The honest version of the metric is ticket size by job type. A shop with a $1,200 blended ticket might be running $180 service calls and $4,500 replacements at a 70/30 mix, or it might be running $400 repairs and $2,800 replacements at a 50/50 mix. Both produce the same blended number. They are not the same business. They have different marketing economics, different staffing requirements, different gross margin profiles, and different cash conversion cycles.
This piece breaks the metric apart by job type, gives the public-source national ranges, and explains why the blended number you see quoted is almost always the wrong target to optimize against.
THE BOTTOM LINE
Across the four primary HVAC residential job types, public-source ranges sit roughly here:
- Service calls (diagnostic only): $75 to $200
- Repairs (parts plus labor): $150 to $650 on the common range, with $1,300+ outliers for major component replacements
- Maintenance and tune-ups: $70 to $200 per visit, $150 to $500 for annual agreements
- Replacements (full equipment install): $5,000 to $15,000+, with high-efficiency or full-system jobs reaching $20,000+
A shop’s blended average is a function of its mix, not its pricing. Mix is what most operators do not actually track. Two shops with identical pricing on every line item can produce blended averages 60 percent apart simply because one runs more replacements.
The actionable metric is ticket size by call type and the mix of those call types month-over-month. Optimize those two and the blended number takes care of itself.
The Master Table
These ranges synthesize public consumer cost guides (Angi, HomeAdvisor, Forbes Home), ENERGY STAR equipment data, and industry-vendor benchmark reports. They reflect U.S. residential national ranges as of 2025-2026. Regional variance is significant — see the regional section below.
| Job Type | Common Range | Typical Average | Source Type |
|---|---|---|---|
| Service call (diagnostic) | $75 - $200 | $100 - $150 | Consumer cost guides |
| Repair — minor (capacitor, contactor) | $150 - $450 | $250 - $350 | Consumer cost guides |
| Repair — moderate (refrigerant leak, fan motor) | $300 - $1,500 | $600 - $900 | Consumer cost guides |
| Repair — major (compressor, evap coil) | $1,300 - $2,500+ | $1,800 - $2,200 | Consumer cost guides |
| Maintenance — single visit | $70 - $200 | $100 - $150 | Consumer cost guides |
| Maintenance agreement (annual, 2 visits) | $150 - $500 | $200 - $350 | Consumer cost guides |
| AC replacement (single system) | $5,000 - $12,500 | $7,500 - $9,500 | Consumer cost guides + ENERGY STAR |
| Furnace replacement | $4,000 - $8,500 | $5,500 - $7,000 | Consumer cost guides |
| Heat pump replacement | $5,500 - $15,000 | $9,000 - $12,000 | Consumer cost guides + ENERGY STAR |
| Full HVAC system replacement | $7,000 - $20,000+ | $11,000 - $14,000 | Consumer cost guides |
| Ductwork (add or replace) | $3,000 - $7,500 | $4,500 - $5,500 | Consumer cost guides |
A note on methodology bias before reading these numbers as gospel: consumer cost guides tend to undershoot real ticket size because homeowners often forget add-ons (refrigerant top-up, condensate pump, surge protector, parts markup) when self-reporting. Vendor benchmark reports (ServiceTitan, FieldEdge) tend to overshoot because their customer base skews toward modern, well-run shops on dispatch software — not the entire industry. The honest ranges sit somewhere in between.
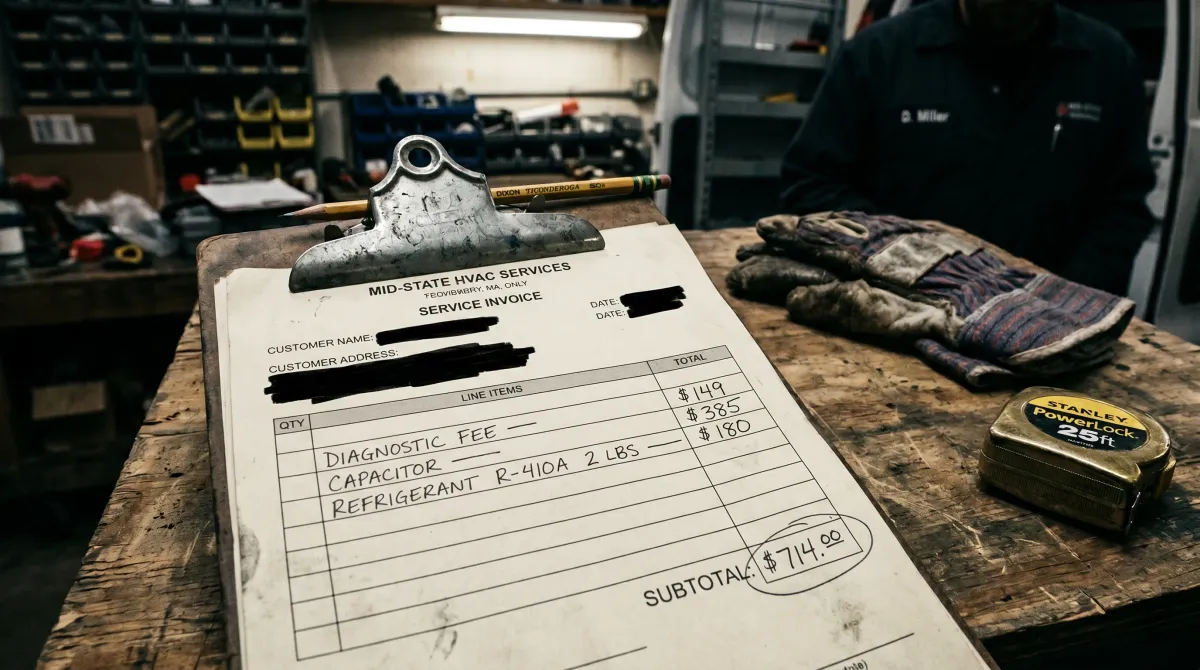
Service Calls — What’s Actually in the Ticket
The service call is the entry-point ticket: a technician arrives, diagnoses the problem, presents options, and either closes the work in the same visit or schedules a return.
National range: $75 to $200 for the diagnostic fee alone. Most shops in 2026 are charging $99 to $159 for a residential service call as the standard. Rural markets sit lower. HCOL coastal markets sit higher.
Two important details that shift the actual realized ticket on this call type:
The diagnostic fee is often credited toward the repair. A $150 diagnostic that converts to a $400 capacitor replacement does not produce a $550 ticket — it produces a $400 ticket because the diagnostic fee is rolled in. Shops that run “free with repair” diagnostics see this dynamic the most.
Service calls that do not convert produce a ticket equal to the diagnostic fee only. A no-fix call where the homeowner says “let me think about it” is a ticket of $150. The shop has paid for the truck, the tech, the dispatch, and the call answer to produce a $150 line — which usually does not cover loaded cost. This is why same-day close rate matters more on service calls than on any other call type.
A healthy service-call operation produces $150 average realized ticket on diagnostic-only calls and converts 70%+ of those calls to a same-day repair, where the realized ticket jumps to $400+.
Repairs — The Long Tail of Variance
Repair is the noisiest job type by ticket size. The range from a $150 capacitor swap to a $2,500 compressor replacement is wider than any other category.
The common-range repairs:
- Capacitor replacement: $150 - $450
- Contactor replacement: $150 - $400
- Condensate pump: $150 - $350
- Fuse / breaker work: $100 - $300
- Thermostat replacement: $200 - $600 (smart thermostats trend higher)
- Refrigerant top-up (no leak fix): $200 - $600
- Refrigerant leak repair: $200 - $1,500 depending on access and refrigerant type
- Blower motor replacement: $400 - $800
- Condenser fan motor: $300 - $650
- Evaporator coil replacement: $650 - $2,400
- Compressor replacement: $1,300 - $2,500+
- Heat exchanger replacement: $1,500 - $4,500
The mix of repair types your shop sees is largely a function of equipment age in your service area and refrigerant transition timing. Service areas with older R-22 systems will see more refrigerant work. Areas with newer equipment will see more electronic / control issues. This is why the same shop in two different ZIP codes can see very different repair-ticket averages.
The single most useful repair benchmark to track for your own shop is average repair ticket on answered calls that close same-visit. That number tells you what your tech is doing on the ground. It is not a national average — it is a shop-specific KPI, and it should sit between $400 and $700 for a healthy residential operation.
Maintenance — The Loss Leader That Pays Back
Maintenance is rarely a profitable line item on its own. It is structured to feed the repair and replacement pipeline.
National range:
- Single tune-up visit: $70 - $200
- Annual maintenance agreement (covers 2 visits, AC and furnace): $150 - $500
- Premium agreements (with priority service, parts discounts, no diagnostic fee): $250 - $600
The realized economics of maintenance are not in the ticket. They are downstream:
- Maintenance customers are 2-3x more likely to call the same shop for a repair.
- Maintenance visits surface conditions that lead to repair quotes — typically $200 to $800 of incremental work per visit on average installed-base systems.
- Maintenance customers replace equipment with the same shop at significantly higher rates than non-agreement customers — meaningfully higher conversion to a $7,000 to $14,000 replacement ticket.
Shops that benchmark maintenance as a standalone profit center misread the metric. Shops that benchmark it on lifetime customer value — agreement plus upsell repair plus eventual replacement — see the actual return.
For a deeper breakdown of maintenance agreement economics, see How HVAC Service Agreements Add $200K Annual Revenue.
Replacements — The Revenue Concentration
Replacement is where the revenue lives. The mix of replacement work in a typical residential HVAC shop accounts for roughly 50 to 70 percent of total revenue while making up only 10 to 20 percent of jobs by count.
National ranges:
- Single AC unit replacement (3-ton, 14-16 SEER): $5,000 - $9,000
- Single AC unit replacement (high-efficiency, 18+ SEER): $8,000 - $12,500
- Single furnace replacement (80% AFUE): $4,000 - $6,500
- Single furnace replacement (95%+ AFUE): $5,500 - $8,500
- Heat pump replacement: $5,500 - $15,000 depending on system size and efficiency
- Full system replacement (AC + furnace, both new): $9,000 - $16,000
- Full system with ductwork: $12,000 - $20,000+
Equipment cost ranges from ENERGY STAR and DOE generally support the lower bound of these ranges; consumer-reported installed prices from Angi, HomeAdvisor, and Forbes Home generally support the upper bound. The real installed ticket sits in between depending on labor cost, permit fees, refrigerant cost, ductwork condition, and any code upgrades required at install.
The replacement ticket is also the single most variable ticket by region. A 3-ton AC replacement in a rural Midwest market may install at $5,500. The same equipment installed in a Bay Area or Boston townhouse with permit, ladder, and ductwork access challenges easily hits $11,000+.
Your Blended Ticket Hides Where Your Revenue Actually Comes From.
Plug your real call volume and ticket size into the Phone Revenue Calculator to see what each call type is actually producing for your shop.
CALCULATE REVENUE PER CALL →The Blended Average — What It Actually Means
When industry sources or marketing agencies quote a single “average HVAC ticket” of $1,400 to $1,800, the number is a weighted average across the full job mix. That number can move wildly based on factors that have nothing to do with the shop’s pricing or sales performance:
- Replacement mix. A shop running 25% replacement jobs versus 12% replacement jobs produces a dramatically different blended ticket at identical pricing.
- Service-only call rate. A shop with a high “tech-rolled-and-no-fix” rate drags blended ticket down with $99 line items.
- Maintenance volume. Shops with large maintenance bases produce more $150 maintenance tickets, lowering blended.
- Time of year. Summer months skew heavy on emergency repair (mid-range tickets). Shoulder seasons skew toward replacement and maintenance (extreme ranges on both ends).
Two shops with identical pricing can produce blended averages of $900 and $1,800 simply based on call mix. The $1,800 shop is not “better at pricing.” It has a heavier replacement mix, often by design (more focus on replacement marketing, sales-trained techs, longer same-day estimate-to-install workflows).
This is why the blended number is a vanity metric. Mix is the lever, not pricing.
Why Your Average Ticket Differs from the National Range
If your numbers are 15-25% above or below national ranges, the explanation is almost always one or more of these:
Regional cost of living. HCOL coastal markets and major metros run 10-25% above national averages on both labor and parts. Low-cost rural and Southern markets run 10-20% below.
Service mix. A shop that has aggressively marketed replacement leads will run blended tickets significantly higher than a shop that runs primarily service-and-repair calls.
Equipment age in service area. Service areas with older equipment installed 12-18 years ago will see higher replacement volume. Areas with newer construction will see higher repair-and-maintenance mix.
Pricing model. Flat-rate pricing books generally produce 15-25% higher tickets than time-and-materials pricing for equivalent work. The pricing book is the single most controllable variable.
Sales process at the truck. Shops that present good-better-best options on every call run higher average tickets than shops that quote single-option pricing.
If your blended ticket sits well below the national range and your call mix is similar, the most common cause is the pricing model and the truck-side sales process — not your market.
Regional and Seasonal Notes
Regional variance. Expect 15-25% above national in HCOL coastal and major-metro markets (Bay Area, Boston, NYC metro, DC, Seattle). Expect 10-20% below national in low-cost rural and small-town markets across the South and rural Midwest. Phoenix, Houston, Dallas, Atlanta, Charlotte, Nashville sit roughly at national ranges with some upside in summer surge months.
Seasonal variance. The mix of work shifts seasonally more than the pricing of any individual line item:
- Summer (May-September in most markets): Heavy emergency-repair mix. Service call volume spikes. Replacement mix dips because homeowners patch rather than replace in-season. Blended ticket often lower than annual average.
- Shoulder seasons (April, October): Heavy maintenance mix. Replacement quoting picks up — homeowners delay replacement decisions until they have time to deliberate. Maintenance agreement enrollment spikes.
- Winter (in cold-climate markets): Heavy furnace-replacement mix. Emergency-repair mix shifts to heating side. Higher ticket sizes on no-heat emergency calls.
- Mild winter (in warm-climate markets): Slowest period. Maintenance and renovation work fills the calendar.
The shop that benchmarks its August blended ticket against its November blended ticket and concludes “we got worse” is misreading the metric. The mix changed. Pricing did not.
How to Calculate Your Own Numbers
The calculation that matters for your operation:
- Pull last 90 days of completed jobs from your dispatch software.
- Tag each one as service call, repair, maintenance, or replacement.
- Calculate average ticket within each tag.
- Calculate the percentage of total jobs and total revenue each category represents.
- Track this monthly. The mix moving is the signal. The blended number is the noise.
Most dispatch software produces this report natively. ServiceTitan, FieldEdge, Housecall Pro, Jobber all expose the data — the report just needs to be configured.
The benchmark to compare against is not the national range. It is your own number 90 days ago, 6 months ago, and 12 months ago. Mix shift is the operational lever. Catching it early is the operational win.
Frequently Asked Questions
What is the average HVAC ticket size in the United States?
The blended average across all residential HVAC job types runs roughly $1,400 to $1,800 in 2026 across well-run shops, but the number is misleading on its own. Service calls average $100-$150, repairs $400-$700 on the common range, maintenance $100-$150, and replacements $7,500-$14,000. The blended number depends entirely on your call mix.
What is the average HVAC service call cost?
A residential HVAC service call (diagnostic only) runs $75 to $200 nationally, with most shops charging $99 to $159 in 2026. The diagnostic fee is often credited toward a same-visit repair, in which case the realized ticket reflects the repair price, not the diagnostic.
What is the average cost of an HVAC repair?
Common-range HVAC repairs run $150 to $650 (capacitor, contactor, motor work, refrigerant top-up). Major component repairs (compressor, evaporator coil, heat exchanger) run $1,300 to $2,500+. The average across all answered repair calls in a healthy residential shop sits in the $400 to $700 range.
How much does an HVAC replacement cost?
Single AC unit replacement runs $5,000 to $12,500 depending on efficiency and tonnage. Furnace replacement runs $4,000 to $8,500. Heat pump replacement runs $5,500 to $15,000. Full system replacement (AC + furnace) runs $9,000 to $16,000, with ductwork bringing the high end above $20,000. Regional cost of living drives 15-25% variance from these ranges.
What is a healthy HVAC maintenance agreement price?
Annual HVAC maintenance agreements covering two visits (cooling and heating tune-ups) run $150 to $500 nationally, with most shops in 2026 pricing between $200 and $350. Premium tiers with priority service and parts discounts reach $400-$600. Maintenance is rarely profitable on the agreement alone — the return comes from downstream repair and replacement conversion from the maintenance customer base.
Why is my average ticket lower than industry benchmarks?
Three common causes: a heavier service-and-repair call mix relative to replacement, a time-and-materials pricing model versus flat-rate, and a single-option presentation process at the truck versus good-better-best. Pricing model and truck-side sales process are the two most controllable levers. The fix is rarely a pricing increase across the board — it is usually a presentation and mix adjustment.
How do I calculate my own ticket size by job type?
Pull the last 90 days of completed jobs from your dispatch software (ServiceTitan, FieldEdge, Housecall Pro, Jobber all support this). Tag each job as service call, repair, maintenance, or replacement. Calculate average ticket and percentage of total revenue within each tag. Track monthly. The shift in mix is the signal — the blended number on its own does not tell you what is changing.
Sources
- Angi (formerly Angie’s List). Cost guides for HVAC service calls, repairs, maintenance, and replacement equipment. Consumer-reported price ranges. angi.com.
- HomeAdvisor. True Cost Guide for HVAC services and equipment. homeadvisor.com.
- Forbes Home. HVAC Cost Guide and AC Replacement Cost Guide. forbes.com/home-improvement.
- ENERGY STAR. Heating, Ventilation and Cooling equipment data and certified product cost ranges. energystar.gov.
- U.S. Department of Energy. Buildings Energy Data Book and HVAC equipment cost references.
- Built on Tenth internal benchmark research on HVAC operator data, 2025-2026.
Methodology note: consumer cost guides tend to undershoot real installed ticket size due to homeowner self-reporting bias. Vendor benchmark reports (ServiceTitan, FieldEdge) tend to overshoot due to customer-base selection. The ranges in this piece are triangulated from both source types.
Built on Tenth is an independent HVAC market intelligence firm providing objective, data-backed diagnostic reporting for HVAC operators. We do not sell advertising, accept referral fees, or offer marketing agency retainers. Our loyalty is strictly to the data.