AUDITOR’S OVERVIEW
Callback rate is the operational KPI that almost every HVAC owner tracks, almost no industry source publishes cleanly, and almost no two shops define the same way. The number floating around — “1-2% is excellent, 5%+ is concerning” — is consistent across trade publications and operator forums, but the consistency hides a deeper problem: the same shop can produce a 1.5% callback rate or an 8% callback rate on identical operations, depending on what gets counted.
Some shops count only true defect callbacks (“we did the work wrong, we came back to fix it”). Some count every warranty visit. Some count parts-return trips. Some count “tech rolled, customer just had a question, no work performed.” The numbers are not comparable across operations because the definitions are not.
This piece treats the definition problem as the article’s spine, lays out the industry-typical benchmark ranges with that caveat, models the actual cost of a callback, and breaks down the five causes that produce most of them. The argument throughout: track callbacks by type, not as a single blended number.
THE BOTTOM LINE
Industry-typical callback rate benchmarks, with the explicit caveat that no peer-reviewed public dataset exists and definitions vary across operations:
- 1-2% — top-quartile residential HVAC operations
- 3-5% — acceptable industry range
- 5-8% — concerning, signals process or training issues
- 8%+ — broken process, requires structural intervention
The cost per callback typically runs $300-$600 when truck roll, tech time, parts redo, and the opportunity cost of the displaced billable work are included. At a 5% callback rate on 1,500 annual jobs, that is 75 callbacks per year and $22,500 to $45,000 in direct cost — before accounting for the customer satisfaction tail.
The most important operational move is to break “callback rate” into its component types and track each separately. A blended 4% callback rate that turns out to be 1% defect callbacks plus 3% parts-return callbacks is not the same problem as a blended 4% callback rate that is 3.5% defect callbacks plus 0.5% nuisance. The first is a parts-stocking issue. The second is a workmanship issue. The fixes are not interchangeable.
The Definition Problem
The single biggest reason “industry callback rate” data is unreliable is that operators do not count the same things. The honest framework requires breaking callback rate into types. Six types matter for residential HVAC:
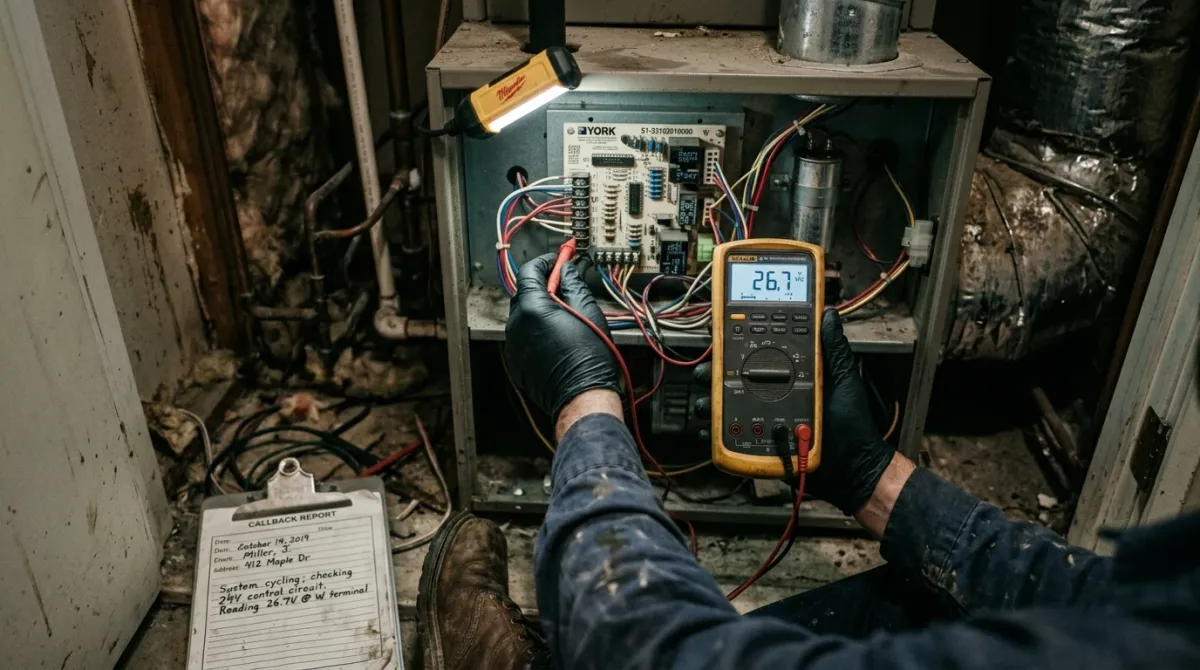
Type 1 — True defect callback. The shop performed work, the work was incorrect or incomplete, and the technician returned to correct it. Examples: a leak that returns within 30 days because the original repair was not properly torqued, a wiring issue that produces a no-cool the day after install, a refrigerant charge that was off-target. This is the strictest definition of “callback” and the one most directly under shop control.
Type 2 — Misdiagnosis callback. The technician diagnosed and repaired one issue, but the actual problem was different. Customer calls back because the original symptom returns. Often involves a no-charge return visit. This is a training/diagnostic-skill issue more than a workmanship issue.
Type 3 — Parts-return callback. The technician did not have the correct part on the truck, completed a partial fix or temporary patch, and returned the next day with the part. Some shops count this as a callback. Some count it as a scheduled return. Categorically distinct from defect callbacks.
Type 4 — Warranty callback. The equipment failed under warranty and the shop is the responsible service party. Sometimes the original install or repair contributed; sometimes it did not. The OEM bears the parts cost, the shop bears the labor cost. Counted as callbacks by some operators, separated as warranty visits by others.
Type 5 — New-issue callback. Customer calls back with a different problem unrelated to the prior visit. Some shops count this if it falls within a defined window (commonly 30 days). Most exclude it because it is a separate revenue event, not a defect.
Type 6 — Nuisance / question callback. Customer calls back with a question that did not require a truck roll. Tech rolled anyway. No work performed. Often produces a no-charge “we explained how the thermostat works” visit. Counted by some shops as callbacks, by others as customer education.
Two HVAC operations with identical actual workmanship can produce blended callback rates that differ by 4-6 percentage points purely because of what gets counted. When you read industry “average callback rate” figures, treat them as approximations of Type 1 + Type 2 — the workmanship-related callbacks. The other types are operational metrics with different fixes.
The Benchmark Ranges
These are industry-typical ranges from trade publications and vendor benchmark reports. They reflect Type 1 (defect) and Type 2 (misdiagnosis) callbacks combined as a percentage of completed jobs over a rolling 12-month window. Sources are not consistently disclosed and methodology varies.
| Tier | Callback Rate (Type 1+2) | What It Indicates |
|---|---|---|
| Top quartile | 1-2% | Strong technical training, structured QC, deliberate hiring |
| Acceptable | 3-5% | Industry-typical, room to improve |
| Concerning | 5-8% | Process or training gap producing systematic recurrence |
| Broken process | 8%+ | Hiring, training, or QC structural failure requiring intervention |
A 1-2% defect callback rate is achievable and produced by operations with: structured technical training programs, post-job QC review, parts-stocking discipline that minimizes Type 3, and hiring practices that select for diagnostic skill over speed.
A 3-5% rate is what most acceptable-tier shops actually produce. Not great, not catastrophic. The variability inside that band — 3% versus 5% — is usually attributable to two specific shops’ parts-stocking and tech-experience profiles.
Above 5% on Type 1+2 specifically (not blended with the other types) almost always points at one of three issues: undertrained techs handling work above their skill ceiling, no formal QC review of completed work, or a hiring/turnover cycle that means too many techs are early-experience.
The Modeled Cost of a Single Callback
What a callback actually costs the shop, modeled at industry-typical loaded rates. Treat as illustrative; your numbers will vary based on local labor rates, fleet costs, and average ticket size.
| Cost Component | Typical Range | Notes |
|---|---|---|
| Truck roll (fuel, depreciation, insurance, maintenance allocation) | $35-$60 | Fixed cost of dispatching a truck regardless of work performed |
| Tech loaded labor (1.5 hrs avg) | $60-$90 | Loaded hourly × time on-site plus drive |
| Parts redo (Type 1 defect) | $0-$150 | Often eaten by the shop on Type 1 |
| Administrative + dispatch time | $20-$40 | CSR call handling, dispatch coordination, billing reconciliation |
| Direct out-of-pocket | $115-$340 | Hard cost in cash |
| Opportunity cost of displaced billable hour | $200-$400 | The job that would have been booked in this slot |
| Total economic cost | $315-$740 | Hard cost plus the revenue not produced because the truck was on a callback |
The opportunity cost is the line most operators miss. A callback does not just cost the truck roll — it costs the alternative service call that did not get booked because the truck was on a callback. At a $1,800 average ticket and a 65% close rate, the displaced revenue per occupied service slot is roughly $1,170. Even discounted to a 25% probability that the slot would have been productively filled, that is $290 of opportunity cost per callback.
At the modeled cost range of $300-$600 per callback and an industry-acceptable 4% callback rate on 1,500 annual jobs, the annual cost is $18,000 to $36,000. At an 8% rate, the annual cost doubles to $36,000 to $72,000. Cutting from 8% to 4% is the financial equivalent of adding $30K-$50K to the bottom line — without any new revenue, marketing spend, or headcount.
Callbacks Are the Quiet Margin Drain Most Operators Never Quantify.
A diagnostic of your callback breakdown by type, paired with your close rate and average ticket, identifies whether your operational drag is workmanship, parts logistics, or training.
ORDER THE DIAGNOSTIC →The Five Causes That Produce Most Callbacks
When operators audit their actual callback log by root cause, the same five categories show up in roughly the same proportions across most residential operations.
1. Diagnostic shortcut on the original visit. Tech ran a single test, identified the most likely cause, replaced a part, did not verify the system was actually fixed before leaving. The original symptom returns within 7-30 days because the underlying issue was different. Most common in mid-experience techs working under time pressure.
2. Inadequate refrigerant charging or commissioning. Tech installed or topped off refrigerant without proper measurement, system runs but does not perform within spec. Customer calls back when bills spike or comfort drops. Most common when refrigerant work is done without superheat/subcooling measurement.
3. Loose connections, fittings, or fasteners. Wire nut not fully seated, flare fitting not properly torqued, sheet-metal screw missing on a register. Vibration or thermal cycling produces a failure within days or weeks. Workmanship discipline issue, almost always tractable through QC review.
4. Wrong part installed. Tech replaced a contactor, capacitor, or motor with the wrong spec or model. Shop ate the parts cost, customer ate the inconvenience. Most common in shops without strong parts-lookup discipline or in shops where techs are sourcing parts on the fly.
5. Customer education gap. Tech completed the work correctly but did not explain the system to the customer. Customer calls back convinced something is wrong (thermostat not set correctly, breaker tripped, filter clogged). No actual defect, but the truck rolled. Often a cultural fix at the tech level — a 90-second walk-through at the end of every visit cuts most of these.
The mix among these five varies by shop. The diagnostic instrument: pull your last 25 callback events and tag each one. If 12 of 25 are loose-connection issues, the fix is QC review. If 12 of 25 are diagnostic shortcuts, the fix is technical training. If 12 of 25 are customer education gaps, the fix is a service-conclusion script.
How Top Operations Track and Reduce Callbacks
Three structural practices show up consistently in 1-2% callback-rate shops:
Practice 1 — Defined callback window with strict definition. A “callback” is any return visit within 30 days of original work for an issue related to that original work. Type 3 (parts-return) and Type 6 (nuisance) are tracked separately and do not roll up to “callback rate.” Type 4 (warranty) is tracked separately. Only Type 1 and Type 2 enter the headline metric.
Practice 2 — Post-job QC review on a percentage of completed work. Either a service manager spot-checks 5-10% of completed jobs the next day (photo review, customer follow-up call, system data pull), or a senior tech rotates with junior techs on a defined cadence to verify quality. This is the practice that drives the 3-5% to 1-2% transition more reliably than any other.
Practice 3 — Callback root-cause logged on every event. When a callback occurs, the cause is logged in one of the six types above (or sub-categories specific to the shop). The log is reviewed monthly for pattern recognition. Recurring patterns lead to specific training or process changes.
The shops without these practices typically know they have a callback problem but cannot identify the structural cause, which means they cannot fix it.
The Hidden Cost: The Customer Satisfaction Tail
The dollar cost of a callback is the easier half. The harder half is what the callback does to the customer relationship.
A callback within the first week of work, handled with a same-day return visit and explicit acknowledgment that the original visit was incomplete, often produces better customer reviews than a clean first-time fix. The customer experiences the company correcting itself professionally. Trust is reinforced.
A callback at week three, handled defensively or with a “we already fixed that” tone, produces lost customers and bad reviews. The customer experiences the company resisting accountability. Trust is broken.
This is why callback handling is a separate skill from callback prevention. Reducing the rate is the long game. Handling each event well is the daily game. Both matter, and they require different operational practices.
The downstream cost shows up in: lower repeat-customer rate, lower maintenance-agreement renewal rate, lower review-rating velocity, and lower referral rate. Difficult to quantify in a clean dollar number per callback, but cumulatively meaningful.
How to Calculate Your Own Callback Rate
Five-step process:
- Define your callback window. Most operations use 30 days from original work. Use it consistently.
- Define your callback types. Pick which of the six types above will roll up to “callback rate” (recommended: Type 1 + Type 2 only). Track the rest separately.
- Pull last 12 months of completed jobs from your dispatch software. Identify return visits within the 30-day window for the same customer and same equipment.
- Tag each return as the appropriate callback type. Type 1 (defect), Type 2 (misdiagnosis), Type 3 (parts return), Type 4 (warranty), Type 5 (new issue), Type 6 (nuisance).
- Calculate Type 1+2 as a percentage of total completed jobs. This is your true callback rate. Track monthly.
Most dispatch software (ServiceTitan, FieldEdge, Housecall Pro, Jobber) supports return-visit linkage, but the tagging discipline has to be implemented by the operator — the platforms do not categorize callback types automatically.
For a deeper view of how callback rate ties into close rate and overall service KPIs, see HVAC Close Rate Benchmarks.
Frequently Asked Questions
What is a good callback rate for an HVAC company?
Industry-typical ranges put top-quartile residential HVAC operations at 1-2% callback rate (counting Type 1 defect and Type 2 misdiagnosis only). Acceptable industry range is 3-5%. Above 5% indicates a process or training issue. Above 8% indicates a structural problem requiring intervention. Note that “callback rate” is not consistently defined across operations — verify what each benchmark source is counting before comparing.
What is the difference between a callback and a warranty visit?
A callback is a return visit caused by incomplete or incorrect work on the original visit, typically counted within a 30-day window. A warranty visit is a return for an equipment defect covered under manufacturer warranty, where the original work may or may not have contributed. Most well-run operations track them as separate metrics, because the fixes are different — callbacks point at workmanship and training; warranty visits point at equipment quality and OEM relationships.
How much does an HVAC callback actually cost?
Modeled total economic cost typically runs $300-$600 per callback when truck roll, tech labor, parts redo (on Type 1), administrative time, and the opportunity cost of the displaced billable hour are all included. At a 4% callback rate on 1,500 annual jobs, that is $18,000-$36,000 per year in direct cost. The hidden tail — customer satisfaction impact on repeat-customer rate, agreement renewals, reviews, and referrals — is meaningful but not cleanly quantifiable.
What are the most common causes of HVAC callbacks?
Five causes produce most callbacks across most residential operations: diagnostic shortcut on the original visit, inadequate refrigerant charging or commissioning, loose connections or fittings, wrong part installed, and customer education gap. The mix varies by shop, but auditing the last 25 callback events almost always reveals one or two dominant causes that point at a specific training or process fix.
How do top HVAC shops reduce callbacks?
Three practices appear consistently in 1-2% callback-rate operations: a strict definition of callback that separates Type 1+2 from parts returns, warranty work, and nuisance calls; post-job QC review on 5-10% of completed work; and root-cause logging on every callback event with monthly pattern review. Most shops below the 1-2% threshold have at least one of these practices missing.
Should warranty work count as a callback?
Most well-run residential HVAC operations track warranty visits as a separate metric from callback rate. Warranty work is driven by equipment quality (OEM and selection), not by the shop’s workmanship. Including it in callback rate distorts the metric and obscures the workmanship-related issues that the shop can actually control. Track both — but track them separately.
How does callback rate affect overall HVAC profitability?
The direct cost (truck rolls, tech labor, parts redo, opportunity cost) of moving from an 8% callback rate to a 4% rate at 1,500 jobs per year is roughly $18,000-$36,000 in saved direct cost. The downstream impact on customer satisfaction, repeat-customer rate, maintenance-agreement renewal rate, and review velocity is harder to quantify but typically larger over a multi-year horizon. Cutting callbacks pays back across both the P&L and the customer base.
Sources
- Trade publications referencing industry callback benchmarks: Contracting Business, ACHR News, Air Conditioning Contractors of America (ACCA) member resources. Public benchmark data is referenced inconsistently with respect to methodology.
- Vendor benchmark reports: ServiceTitan, FieldEdge, and Housecall Pro have at various times published or referenced callback data drawn from their customer bases. Methodology and sample sizes are not consistently disclosed.
- U.S. Bureau of Labor Statistics. Occupational Employment and Wage Statistics, May 2024 — HVAC Mechanics and Installers (49-9021). Used as the basis for tech labor cost in the modeled callback cost calculation. bls.gov/oes
- Built on Tenth. HVAC Close Rate Benchmarks. /hvac-research/hvac-close-rate-benchmarks
- Built on Tenth internal benchmark research on residential HVAC callback root causes and operational practices, 2025-2026.
Methodology note: there is no peer-reviewed public dataset on HVAC callback rate with disclosed methodology and sample size. Benchmark ranges in this article are industry-typical figures referenced consistently across multiple trade publications and vendor reports, with the explicit caveat that callback definitions vary across operations. Cost-of-callback math is modeled and labeled illustrative — apply your own loaded labor rate, fleet cost, and average ticket to your operation.
Built on Tenth is an independent HVAC market intelligence firm providing objective, data-backed diagnostic reporting for HVAC operators. We do not sell advertising, accept referral fees, or offer marketing agency retainers. Our loyalty is strictly to the data.