Most HVAC owners decide where to spend their marketing budget based on one of three things: what worked for someone else in a Facebook group, what their agency recommended, or what they tried last year.
None of those are numbers.
Before you renew your agency contract, add spend to a new channel, buy more Angi leads, or run a postcard campaign, you need four numbers. Without all four, you are not making a marketing decision. You are making a guess and calling it a strategy.
The good news: all four are in your existing data. You do not need new software. You do not need a consultant. You need 30 minutes and the right questions.
Here they are.
Number 1: Your Booking Rate on Answered Calls
This is the number that reveals whether your marketing problem is actually a phone problem.
Booking rate is simple: out of every 100 calls your team answers, how many turn into booked jobs?
Across the 300-plus companies in our data set, the average booking rate on answered calls is 42%. Top performers hit 62% to 70% consistently.
A company answering 200 calls per month at a 38% booking rate books 76 jobs. The same company at 62% books 124 jobs. Same call volume. Same marketing spend. 48 additional jobs per month from one number moving.
At a $320 average ticket, that gap is $15,360 per month. $184,320 per year. Not from more marketing. From answering the phone better.
Why it matters before you spend: if your booking rate is under 45%, adding marketing spend adds calls you are already failing to convert. You are buying leads to lose. Fix the booking rate first. Then add volume.
How to pull it: take last month’s inbound call count from your phone system or call tracking and divide by booked jobs for the same period. If you do not have call tracking on your phones right now, that is a problem worth fixing before spending another dollar on ads.
The Phone Revenue Calculator will show you exactly what weak answer rate and booking rate are costing you per month in real dollars. If your phones are leaking before the board fills up, fix that before you add spend.
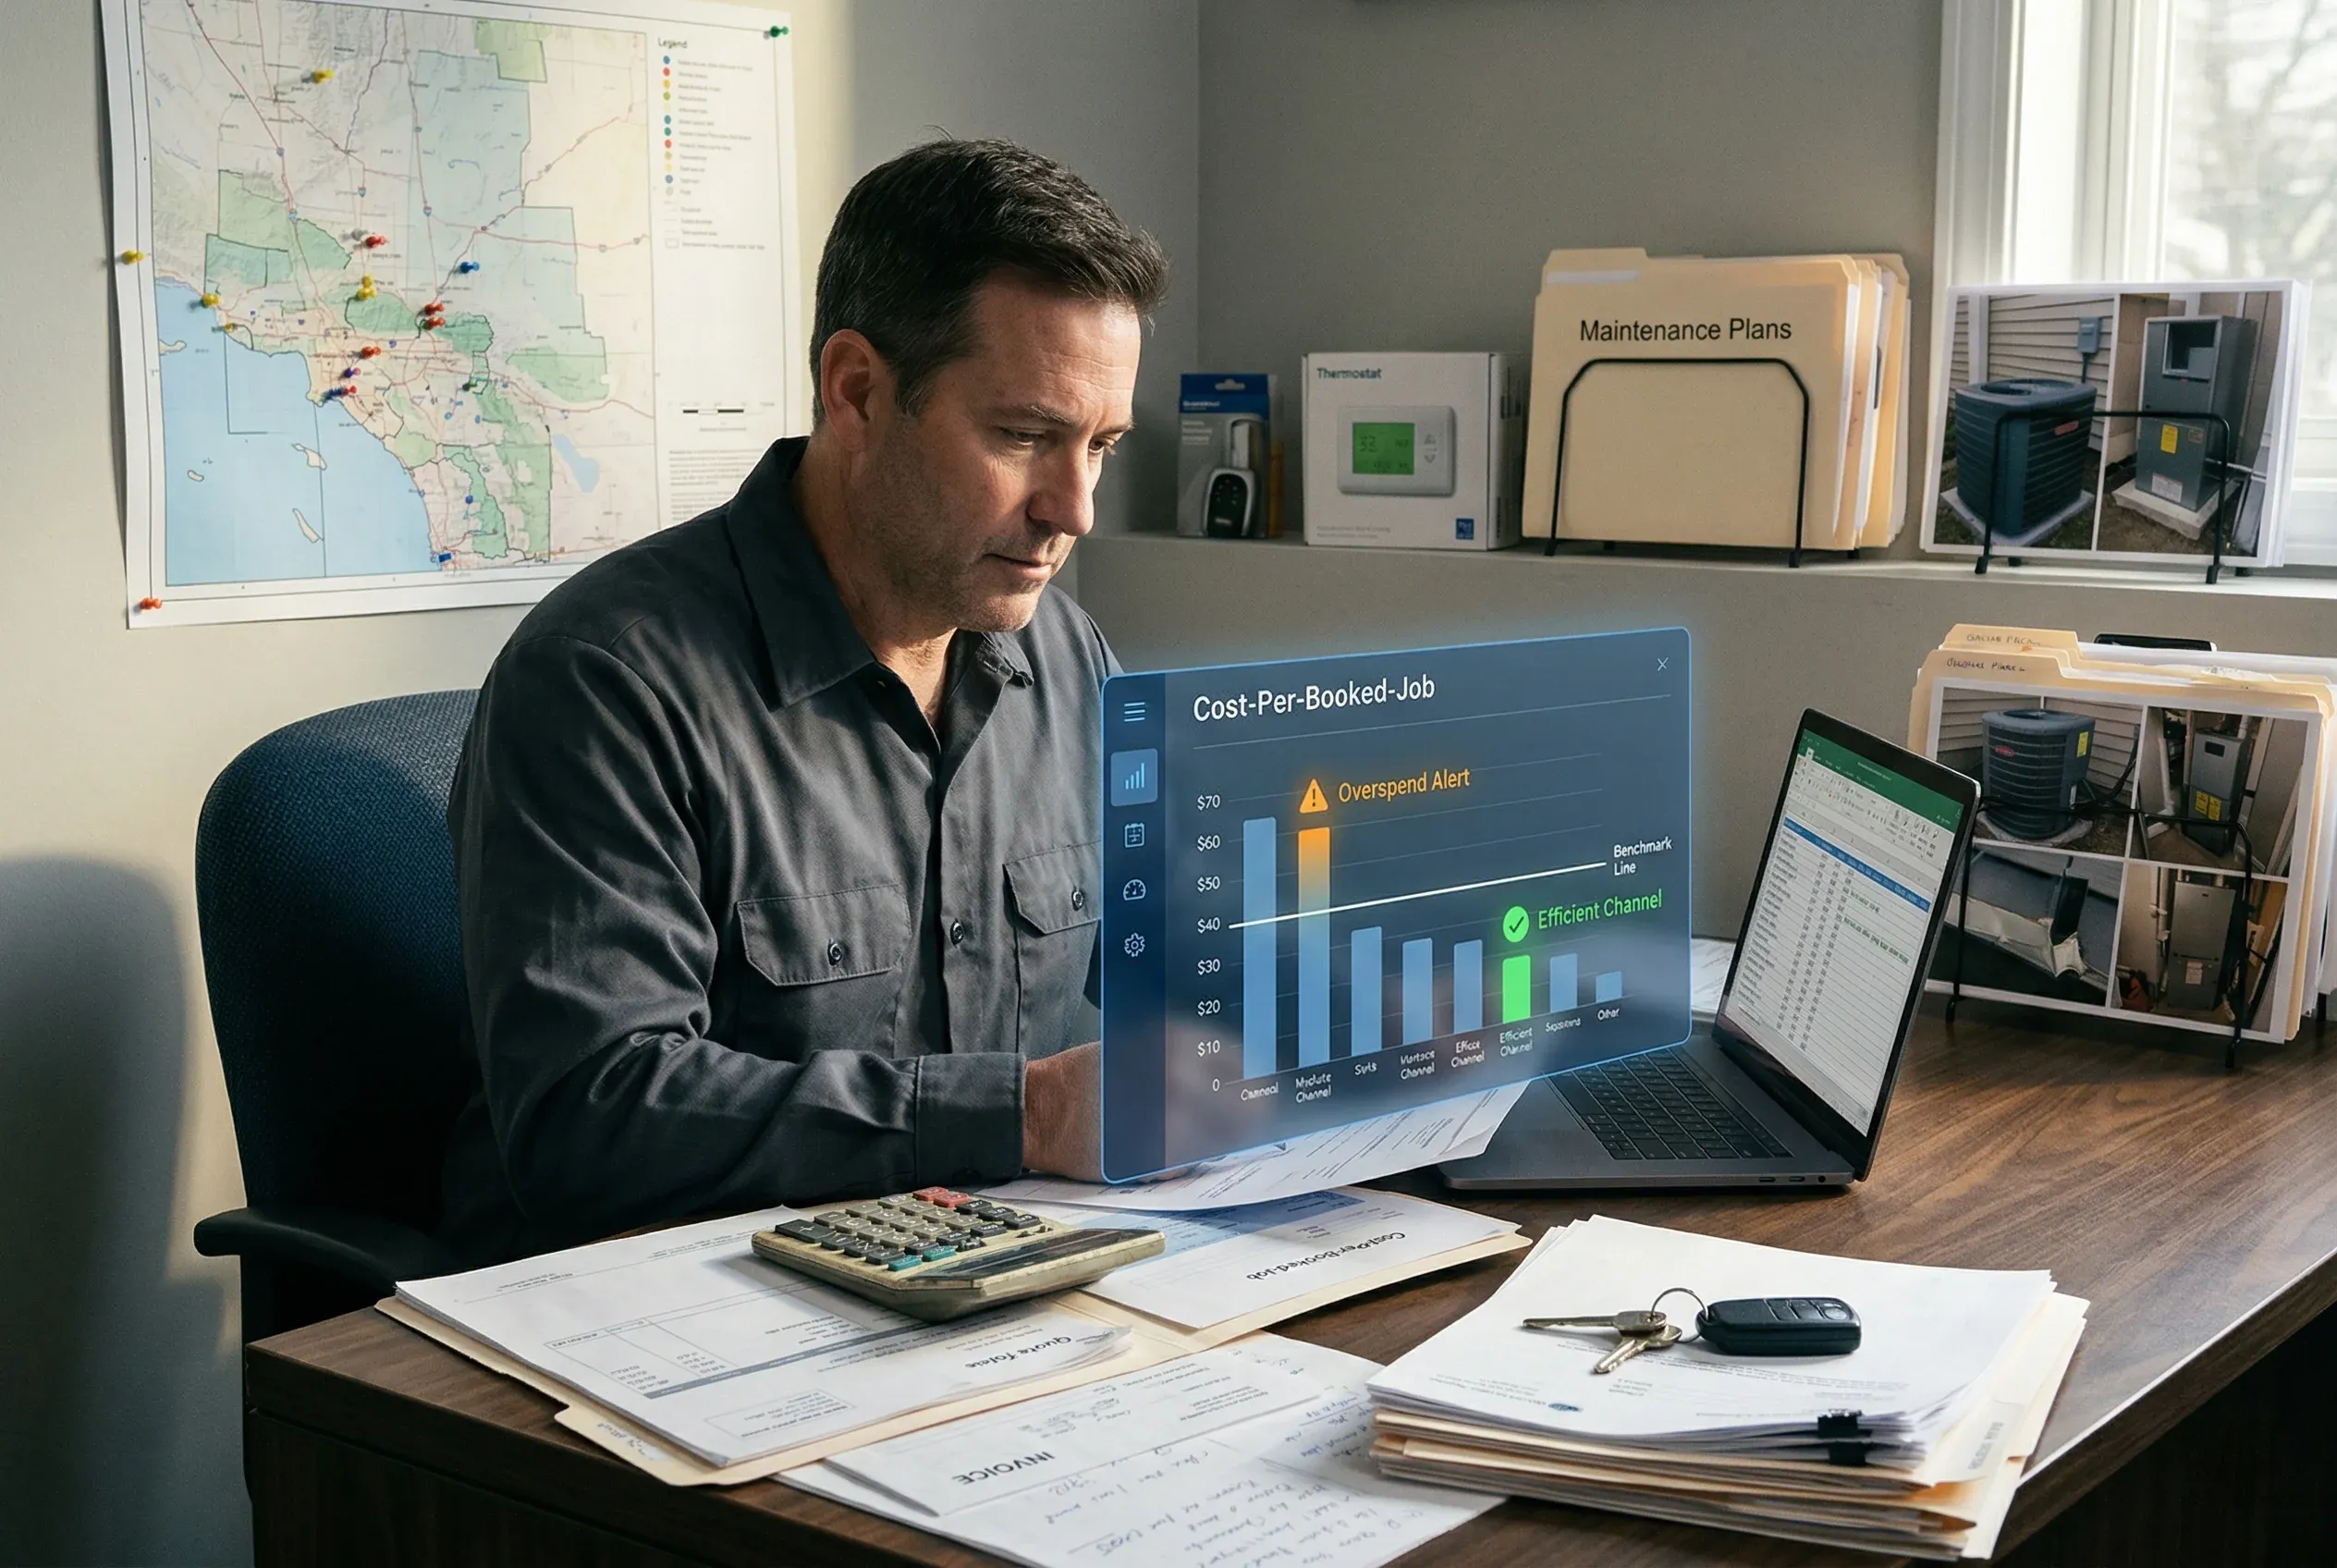
Number 2: Your Cost Per Booked Job by Channel
Most HVAC owners track cost per lead. That number is nearly useless on its own.
A $40 lead that books at 18% costs $222 per booked job. A $95 lead that books at 64% costs $148 per booked job. The cheaper lead is more expensive. Cost per lead hides this completely.
Cost per booked job is the only marketing metric that connects spend to revenue. Here is how to calculate it for each channel you are running:
Take your total spend on a channel in a given month. Divide by the number of jobs booked from leads on that channel. That is your cost per booked job.
Benchmarks for comparison:
Google LSA in a mid-size market typically delivers booked jobs at $80 to $180. Google Ads search runs $150 to $350 depending on competition and seasonality. Angi and lead aggregators often land at $200 to $400 per booked job once you account for leads that never answer or price-shop without booking.
If you cannot calculate cost per booked job by channel right now, you have a tracking problem. You are spending money you cannot measure. That is the first thing to fix before adding more.
The Marketing Cost Calculator benchmarks your cost per booked job against what stronger operators are producing in your market. Run your current numbers through it before your next agency conversation.
If your agency is still reporting leads instead of booked jobs, read the HVAC marketing agency report card next. It explains exactly why this number is the one most agencies avoid reporting.
Number 3: Your Average Ticket
Average ticket is the number that determines whether more volume is actually the answer.
A company averaging $220 per job needs 30% more jobs to match what a company averaging $320 per job produces from the same call volume. That 30% more jobs requires 30% more marketing spend, 30% more truck capacity, and 30% more technician hours. Or you raise average ticket and produce the same revenue gain with nothing extra.
Average ticket in HVAC is driven by three things: your job mix, your flat-rate pricing consistency, and what your technicians present on every call.
What a healthy number looks like:
Residential service and repair runs $300 to $500 per job in most markets. Replacement and installation runs $6,500 to $10,000 depending on system size and market. If your blended average across all job types is under $280, you have a job mix problem, a pricing problem, or both.
The fastest diagnostic: pull average ticket by individual technician for the last 90 days. If the spread between your highest and lowest producer is more than $80, the gap is almost never work ethic. It is pricing inconsistency. Different techs are quoting the same job at different prices and the low quotes are dragging your average down.
A flat-rate price book used consistently closes that gap. If you have one loaded and average ticket is still low, the problem is that it is not being used. The pricing side of this problem is broken down in the HVAC flat-rate pricing article.
Why it matters before you spend: adding 50 more calls per month to an operation with a $220 average ticket produces less revenue than fixing average ticket to $320 and keeping call volume identical. More marketing spend on a low-average-ticket operation has lower ROI than fixing the pricing first. Know your number before you add budget.
Number 4: Your Follow-Up Close Rate on Unbooked Estimates
This is the number that reveals money already on the table that is not being picked up.
Our data shows 68% of estimates sent by HVAC companies are never followed up. On a company running 25 estimates per week, that is 17 estimates per week going cold without a single call, text, or email.
Follow-up close rate is what percentage of those unbooked estimates eventually convert when you contact the homeowner again.
Companies with an active follow-up sequence close 15% to 25% of previously unbooked estimates. Companies with no follow-up sequence close effectively zero.
The dollar math on a $3M HVAC company:
At 25 estimates per week, 17 go un-followed. At a $4,200 average replacement estimate and a 15% follow-up close rate, that is 2.5 additional jobs per week from estimates already written. At $4,200 per job, that is $10,500 per week. $546,000 per year. From jobs where the homeowner already called and asked for a price.
That is not a marketing problem. That is a follow-up problem. And it is the last place most owners look before spending more on ads.
How to find your number: pull all estimates sent in the last 60 days and filter for unbooked. Count how many have follow-up activity logged in your CRM. Phone attempts, texts, emails. If fewer than 40% have any follow-up contact, the revenue sitting in your estimate pipeline is larger than most owners want to admit.
The Estimate Follow-Up Calculator shows the dollar value sitting in your unbooked estimates right now based on your actual volume and average ticket. If you want the longer diagnostic on why this leak gets ignored, read the estimate follow-up gap article.
What to Do With All Four Numbers
Run them in order. Each one tells you something different about where the leak is.
Booking rate under 45%: your phone and CSR process is the problem. Adding marketing spend adds calls you are not converting. Fix the phones first.
Cost per booked job above benchmark: you have a tracking problem, a lead quality problem, or your booking rate is dragging the economics. Identify which before renewing.
Average ticket under $280: you have a pricing or job mix problem. More volume at a low average ticket does not solve the profitability gap. It compounds it.
Follow-up close rate near zero: you have money already in your pipeline that is not being collected. This is the cheapest revenue available. It costs no additional marketing spend.
Most HVAC companies running this diagnostic find at least two of the four numbers are broken. The order matters. Booking rate and average ticket are usually the highest-leverage fixes because they improve the ROI of every marketing dollar you are already spending.
The Question Worth Asking Before You Spend Anything Else
If someone asked you right now: what is your booking rate, your cost per booked job on Google, your average ticket, and your follow-up close rate on estimates this month, could you answer all four without digging for 20 minutes?
If the answer is no, you are flying without instruments.
The four tools above are free and give you each number independently. If you want a focused comparison against the top 3 competitors in your market across Google Maps, website basics, call responsiveness, and visible marketing activity, that is what the HVAC Local Market Report is for. Written analysis. Delivered in 5 days. No calls required.
If you are about to renew software or hire an agency, read how to audit your ServiceTitan ROI before you renew and what to ask an HVAC marketing agency before you sign after this. They apply the same four-number framework to two decisions owners get wrong all the time.
Built on Tenth studies how stronger HVAC companies win more calls, close more demand, and where revenue leaks out. No agency. No retainer. No incentive to recommend more ad spend.