A busy HVAC business and a profitable HVAC business are not the same thing.
The owners who know the difference are the ones tracking the right numbers. Not dozens of metrics across a dashboard they check once a month. Eight specific benchmarks that tell them whether the business is performing or just working hard.
This page maps those eight numbers, the ranges that separate average from strong, and the deeper resources for each one if your number is outside the range.
It is broader than the marketing-specific Four Numbers framework already on the site. That piece helps you diagnose marketing readiness. This one is the wider operating dashboard.
[Image placeholder: Clean benchmark summary card showing all 8 numbers in a two-column layout with ranges indicated]
The 8 Numbers
These benchmarks fall into two categories: operations-side numbers that reflect what happens after a customer calls, and market-side numbers that determine how many customers call in the first place.
Most HVAC business problems live in one of these two categories. A company that has strong operations but weak market visibility is leaving calls on the table. A company with strong market visibility but weak operations is converting that traffic poorly. Both paths produce underperformance. The benchmarks tell you which problem you have.
1. Revenue Per Technician
What it measures: How efficiently each truck is producing revenue.
Normal range: $120,000 to $200,000 per technician annually. Strong range: $200,000 to $350,000. Top quartile: $280,000 to $400,000+.
This is the single most important diagnostic metric for operational performance. A company at the bottom of the normal range with the same call volume as a top-quartile company is losing the difference to dispatch inefficiency, low average ticket, or poor close rate.
Revenue per technician is driven by jobs per day, average ticket per job, and close rate. Fix dispatch to improve jobs per day. Fix pricing and flat-rate discipline to improve average ticket. Fix options presentation and follow-up to improve close rate.
Go deeper: HVAC Revenue Per Truck Benchmark and Dispatch Efficiency. Tool: Revenue Per Technician Benchmarker.
2. Booking Rate
What it measures: What percentage of inbound calls become booked appointments.
Industry average: 42%. Strong range: 50% to 65%.
This is the most commonly undertracked metric in HVAC phone operations. A company answering 80% of its inbound calls but booking only 35% of them is losing more revenue to the booking gap than to the answer gap.
Booking rate varies by call type. Emergency calls should book at 70%+. Replacement inquiry calls may book at 30% to 45%. Track them separately.
Go deeper: HVAC Revenue Per Call. Tool: Phone Revenue Calculator.
3. Close Rate by Call Type
What it measures: What percentage of in-home service or estimate calls result in a booked job.
Replacement estimate benchmark: 30% to 55%. Service and repair benchmark: 60% to 80%. Emergency repair benchmark: 85% to 95%.
A single blended close rate hides more than it reveals. Break it into call types. Your replacement close rate is almost certainly the most improvable number, with financing, options presentation, and follow-up speed as the primary levers.
A close rate above 70% on replacement estimates is often a signal that pricing is too low.
Go deeper: HVAC Close Rate Benchmarks and Replacement Estimate Win Rate. Tool: Estimate Follow-Up Calculator.
4. Net Profit Margin
What it measures: What the business actually keeps after all expenses.
Industry average: 2% to 5%. Well-run operations: 10% to 20%.
Revenue growth at 3% net margin produces more work for less money per dollar of effort. Profitability is a function of pricing discipline, overhead management, and service mix, not just revenue size.
A company doing $2.2M at 14% net margin is more financially healthy than one doing $3M at 4% net margin. Gross margin by service type is the first number to check. If gross margin is healthy but net is thin, overhead and below-the-line expenses are the issue.
Go deeper: HVAC Net Profit Margin Benchmarks. Tool: Marketing Cost Calculator.
5. Map Pack Position
What it measures: Where your Google Business Profile ranks in local search results.
What matters: Top 3 versus not top 3.
The map pack captures roughly 42% of all clicks on a local HVAC search. Position 1 takes roughly 44% of those map pack clicks. Position 4 and below take a fraction of what position 3 earns.
Map pack position is a function of review count, review velocity, category setup, photo activity, posting frequency, and website alignment. It is not something you buy. It is something you build, and it compounds over time.
This is a market-side benchmark. Operations improvements do not fix a map pack problem.
Go deeper: HVAC Google Map Pack Ranking. Tool: GBP Scorecard.
6. Review Count and Velocity
What it measures: Your Google review total and the pace at which you are generating new ones.
Entry floor for competitive markets: 75 to 150 reviews. Strong competitive position: 150 to 300+. Target monthly velocity: 15 to 25 new reviews per month.
Review count is visible to homeowners and used as a credibility signal before they call. Review velocity is weighted by Google’s local ranking algorithm and signals ongoing business activity.
A large but dormant review profile loses ground over time to a smaller but actively growing one. The combination of count, velocity, and rating quality (4.5+ stars) is what determines whether reviews are helping or neutral.
Go deeper: HVAC Google Reviews and Review Velocity. Tool: GBP Scorecard.
7. Website Conversion Rate
What it measures: What percentage of website visitors take a conversion action (call, form submission, booking).
Industry average: Around 3% for general HVAC sites. Strong landing pages: 8% to 15%. Emergency service intent pages: Higher.
Most HVAC websites convert at the low end of this range because they are designed as informational brochures rather than conversion-focused tools. Specific, offer-driven landing pages for emergency service, replacement inquiry, or new customer offers consistently convert at double to triple the rate of general homepages.
Website conversion rate connects directly to your cost per booked job across all paid channels. Higher conversion means lower cost per booked job on the same traffic budget.
Go deeper: HVAC Cost Per Booked Job by Channel. Tool: Website Conversion Audit.
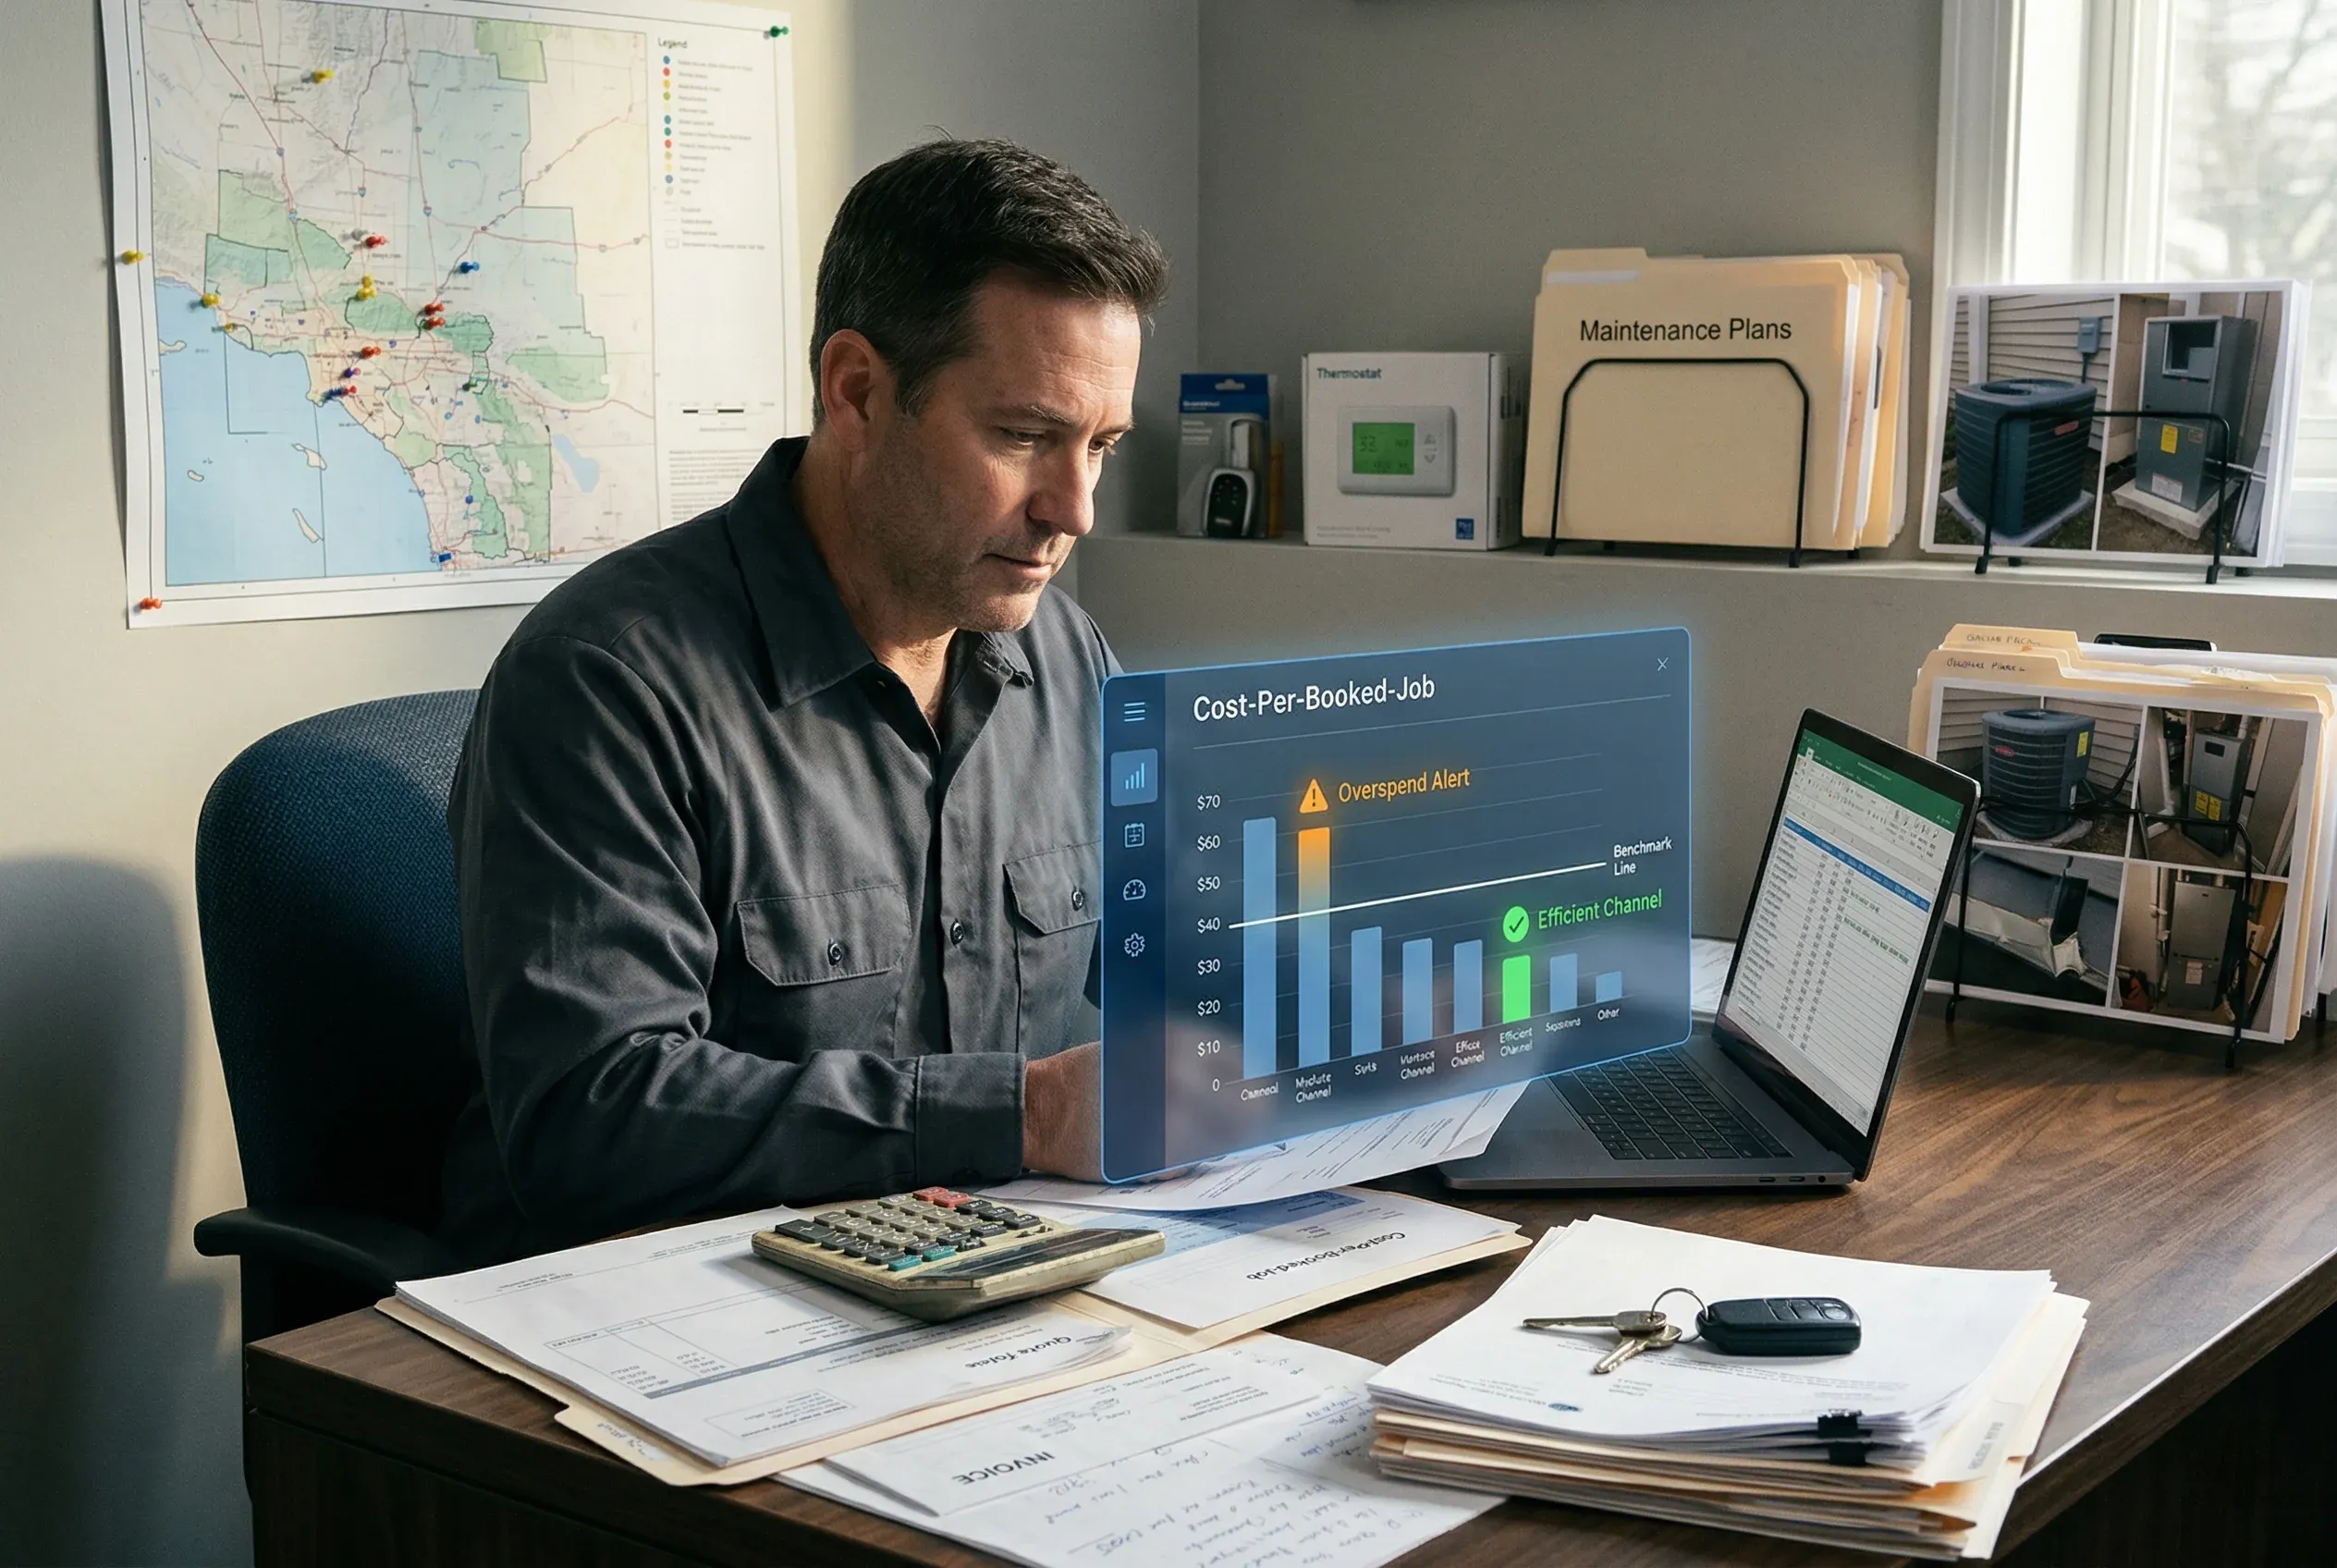
8. Cost Per Booked Job by Channel
What it measures: What you spend in marketing to produce one booked job, by channel.
Rough ranges: Google Ads: $100 to $180 per booked job depending on conversion rate and booking rate. LSA: $75 to $130 per booked job with strong CSR performance. Map pack and GBP (organic): Near-zero marginal cost per booked job when ranking in the top 3. Organic content: Near-zero marginal cost after ranking is established.
Cost per lead is what agencies report. Cost per booked job is what owners should track. The gap between those two numbers is where marketing spend leaks.
Go deeper: HVAC Cost Per Booked Job by Channel. Tools: Marketing Cost Calculator and Agency Report Card.
Operations-Side vs Market-Side: What Each Number Tells You
[Image placeholder: Two-column diagram separating the 8 benchmarks into operations-side (revenue per tech, booking rate, close rate, net margin) and market-side (map pack position, review velocity, website conversion, cost per booked job) categories]
The first four benchmarks are operations-side: they measure what happens after a customer calls or arrives at your door. If these are weak, more marketing spend makes the problem worse by sending more leads into a leaky conversion process.
The last four are market-side: they measure your ability to generate qualified calls in the first place. If these are weak, excellent operations are producing strong results from a small pool of opportunities.
Most HVAC companies have a problem on both sides, but one side is usually more limiting than the other. Identify which one is your constraint before deciding where to invest.
Using These Numbers with the HVAC Local Market Report
Your own benchmarks only tell part of the story. They tell you how your operation is performing. They do not tell you how your operation is performing relative to the competitors your customers are comparing you to.
The HVAC Local Market Report is built to show the market-side picture: where you rank in your specific service area, which competitors are outranking you, what their visible trust gaps are versus yours, and what that competitive gap is likely costing in missed calls and booked revenue.
It is a $200, 48-hour, written-only report. No calls. No upsell. The goal is to give you enough market-specific clarity to make a better decision about where to focus first.
Use the benchmarks in this article to know what questions to ask. Use the HVAC calculators to run the math on your specific numbers. Use the report when you want to see exactly where you stand in your market.
Frequently Asked Questions
Which HVAC benchmark should I focus on first?
Fix whichever constraint is limiting you most. If your revenue per truck is low, start with dispatch and pricing. If your booking rate is below 40%, start with CSR performance and answer rate. If your map pack position is outside the top 3, start with review velocity and GBP optimization. Do not invest more in marketing until your booking rate is at or above 45%.
Do these benchmarks apply to all HVAC companies?
These benchmarks apply most directly to residential HVAC service companies in the $1M to $5M revenue range. Commercial-only operations have different service economics and different close rate expectations. The directional guidance holds for most residential and mixed-residential companies, but specific numbers should be calibrated to your market and service mix.
How often should I review these numbers?
Booking rate, revenue per technician, and close rate are worth reviewing monthly. Map pack position and review velocity can be reviewed quarterly. Net margin and cost per booked job should be reviewed monthly during high-growth periods and quarterly during stable periods.
What is the fastest benchmark to improve?
Booking rate improvements from CSR training typically show within 30 to 60 days. Review velocity improvements from a consistent ask-after-every-job system show within 60 to 90 days. Map pack ranking improvements take three to six months. Net margin improvements depend on what is compressing them.