Most HVAC owners know their total revenue. Few know their revenue per truck.
That gap matters more than most owners realize. Total revenue tells you how big your business is. Revenue per truck tells you how efficiently it is running, and whether adding the next truck will actually grow revenue or just spread the same inefficiency across a larger fleet.
Here is the spread in the industry: the top 10% of HVAC service companies generate $180,000 to $280,000 in annual revenue per technician. The bottom 25% generate $80,000 to $120,000 from the same technician working the same 40 to 50 hours per week, according to operational data across hundreds of HVAC companies.
Same labor market. Same customer base. Same equipment brands. A 2 to 3x difference in output.
The gap is not about working harder. It is about average ticket, jobs per day, what happens on every call, and whether trucks are rolling toward the right jobs in the right order. Most of this is within the owner’s control. Most owners have never looked at it by truck.
If you are trying to separate a fleet-efficiency problem from a local-demand problem, the HVAC Local Market Report gives you the market-side answer. This article is the operating-side benchmark for once those calls are already coming in.
[Image placeholder: HVAC fleet of service vans lined up outside a shop with a whiteboard showing revenue per truck figures for each vehicle]
The Number and How to Calculate It
Revenue per technician (annual): Total revenue for the year divided by number of field technicians. This is your blended company number.
Revenue per technician (monthly): Total invoiced revenue for the month divided by field tech headcount. Track this monthly to see seasonal patterns and whether operational changes are actually moving the needle.
Revenue per technician by individual: Pull invoiced jobs by assigned technician for the last 90 days. Divide by working days. Multiply by 250 for an annual run rate. This is the number that tells you who is performing and who is not, and whether the gap is a training issue, a dispatch issue, or a pricing issue.
Most field service platforms, ServiceTitan, Housecall Pro, FieldEdge, generate this report natively. If yours does not, pull job revenue by assigned tech from your invoicing system. It takes 20 minutes the first time.
The wage-to-revenue ratio check: A useful parallel calculation is what percentage of revenue each technician is generating relative to their compensation. The target in healthy HVAC operations is 14 to 20% of revenue going to technician wages. A tech earning $52,000 per year should be generating roughly $260,000 to $370,000 in annual revenue. If they are generating $140,000 at $52,000 in wages, you are paying 37 cents of wages for every dollar of output, more than double your target.
This ratio, run by individual technician, surfaces overpaying relative to output before the annual P&L shows it as a margin problem.
What Driving Actually Costs You
Before getting into the performance drivers, one number frames everything: the cost to roll a truck.
According to ACCA’s 2025 financial analysis, when you factor in wages, benefits, vehicle expenses, insurance, and non-billable windshield time, the average cost to roll an HVAC truck is $84.40 per hour. That is before a single dollar of profit.
At $84.40 per hour, a 30-minute service call charged at $89 produces $4.60 per hour in margin. Not per job. Per hour. For the call duration only, not accounting for the drive there and back.
The implication: HVAC trucks need to be running high-value work to cover their operating cost and generate meaningful margin. Service calls priced at emergency diagnostic minimums with nothing added are not building a business. They are treading water at $84.40 per hour in the background.
The same ACCA analysis found that parts runs, a technician leaving a job to pick up a part, cost roughly one hour of billable time per run. At $84.40 per hour in truck cost plus the lost billable revenue from the job sitting idle, a single parts run costs $150 to $300 depending on the job. On a company running 8 trucks with one parts run per truck every three days, that is $9,600 to $19,200 per month in parts-run losses before accounting for customer dissatisfaction from extended waits.
These are operational costs that do not show up as line items. They show up as revenue per truck being 30 to 40% lower than it should be. The HVAC Dispatch Efficiency article covers the full picture of what windshield time and routing decisions cost across a fleet.
The Four Variables That Drive Revenue Per Truck
Variable 1: Average Ticket
A truck running 4 jobs per day at a $220 average ticket generates $880 in daily revenue. The same truck at $380 average generates $1,520. Same hours. Same fuel. $163,200 annual difference per technician.
Average ticket in HVAC is driven by three things: job mix (replacement and installation calls produce 5 to 10x more revenue than tune-ups), flat-rate pricing discipline, and upsell behavior on every call.
On job mix: a tech running 4 tune-ups per day at $150 each generates $600. A tech running 3 service calls and one replacement estimate per day averages well over $1,000 in daily revenue, even before the replacement closes. Companies that route replacement-leaning calls to their strongest closers and tune-up calls to newer techs are managing job mix deliberately. Companies that randomize dispatch are mixing high-value and low-value calls without tracking the revenue difference by technician.
On flat-rate pricing: techs who quote from memory introduce inconsistency that almost always skews low. An owner who reviewed technician quotes found the same job quoted at $340, $290, and $410 depending on who ran the call. All three techs were working off the same cost structure. The variation was confidence and training, not cost reality. Flat-rate pricing books remove this variation.
Variable 2: Jobs Per Day
Three to five jobs per day on service and repair work is the top-performing range per ServiceTitan’s benchmarks across HVAC companies. Fewer than three completed jobs per day consistently indicates a dispatch, routing, or parts availability problem, not a demand problem.
The cost of one fewer job per day per technician: on a $350 average ticket and 250 working days per year, each lost job per day is $87,500 per technician in foregone annual revenue. On a 6-truck fleet, the difference between 3.2 jobs per day and 4.0 jobs per day is $420,000 in annual revenue.
This is why dispatch efficiency deserves its own analysis rather than being bundled into “productivity.” The HVAC Dispatch Efficiency article goes deep on what moves job count per day through routing and scheduling decisions.
Variable 3: Close Rate on Estimates and Replacements
A tech who arrives at a replacement estimate call and converts it at 35% produces fundamentally different revenue per truck than one converting at 55% on the same call type. The difference on a $9,000 average replacement ticket is $9,000 per additional close, compounding across every estimate the tech runs.
Close rate is shaped by flat-rate pricing discipline, options presentation (presenting three system tiers rather than one recommendation), and financing availability. The HVAC Close Rate Benchmarks article covers what healthy close rates look like by call type and what moves them.
Variable 4: Service Agreement Attach Rate
A tech who attaches a maintenance agreement on 35% of eligible service calls is building a recurring revenue book that produces pre-committed future dispatch slots. A tech at 10% attach rate is not. Over 12 months, the difference in agreement revenue and downstream repeat business is substantial.
The connection to revenue per truck: agreement customers generate 2 to 3x the lifetime revenue of one-time service customers. A tech with 80 active agreements in their book produces a different baseline revenue floor than one with 15. The Maintenance Agreement Attach Rate Benchmarks article covers the targets and what moves attach rate in practice.
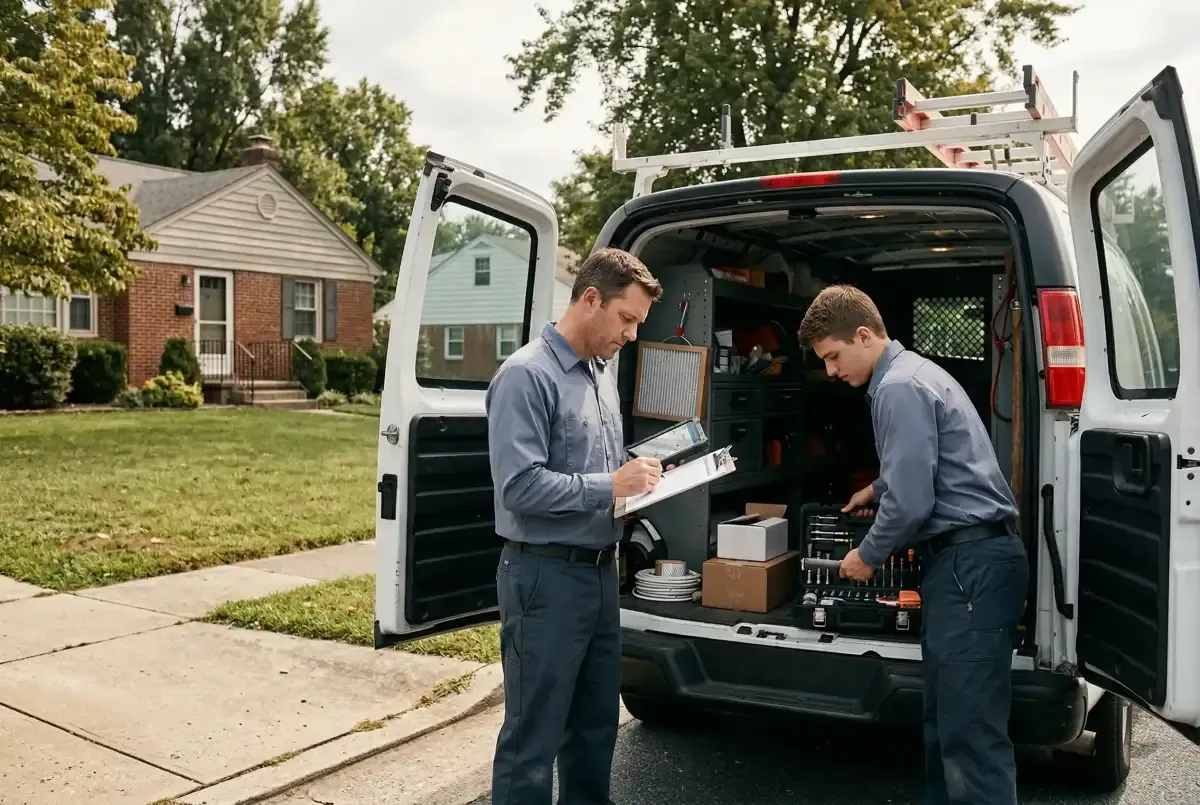
[Image placeholder: Technician reviewing a service completion checklist on a tablet beside a residential HVAC unit, showing pricing, add-on recommendation, and maintenance agreement offer fields]
Reading the Individual Technician Spread
When you pull revenue by technician, the spread between your top and bottom producer tells you something specific about your operation.
A normal spread: 20 to 30% revenue difference between your top and bottom producer. Largely explained by experience level and job mix assignment. Closable with pricing training and better job routing.
A problem spread: 40 to 60% revenue difference. This indicates a systems failure: either dispatch is routing better jobs to certain techs, pricing varies by who quotes the job, or one technician has a specific behavior gap that has not been identified.
Pull the last 90 days of revenue by technician. For each tech, calculate total revenue, days worked, average daily revenue, jobs per day, and average ticket.
Low average ticket with normal job count: pricing gap or job mix skew. Check whether they are using the price book and whether their callbacks are being assigned back to them.
Low job count with normal average ticket: dispatch and routing problem. Map their daily routes and compare drive time against higher-performing techs.
Low job count and low average ticket: this technician needs direct observation and coaching. Review their last 10 work orders for patterns before having the conversation.
Most performance gaps have a specific, identifiable cause. Finding it takes 30 minutes with the right data. Not finding it costs $40,000 to $80,000 per year per underperforming technician in foregone revenue.
The Hiring Decision: When Revenue Per Truck Tells You Yes or No
The most expensive mistake in HVAC growth is adding a truck to solve a revenue problem that is actually a productivity problem.
If your 6-truck fleet is averaging $130,000 per truck and you add a seventh, you now have 7 trucks averaging $130,000. You have added a truck payment, insurance, tools, and a technician salary, and generated the same output per head you had before. Total revenue increases but margin per truck stays flat or declines if the new tech underperforms the average.
The hiring signal that actually warrants adding a truck: your existing trucks are running at or above 72% billable utilization consistently, AND you are turning down or significantly delaying calls because you do not have available field capacity, AND your revenue per truck is above $200,000 annually.
If all three are true, a new truck generates close to its full revenue potential from month one. If any of the three are broken, adding headcount compounds the problem.
The two-week test before committing to a hire: track billable hours per technician for two consecutive weeks. If your top three techs are running at 75% utilization or above and still declining calls, you need capacity. If they are running at 55 to 60% utilization and declining calls, you have a scheduling or dispatch problem, not a headcount problem.
What to Do This Week
- Calculate your revenue per truck for last month. Total invoiced revenue divided by field tech headcount. Multiply by 12 for an annual run rate and compare to the $180,000 to $280,000 benchmark.
- Pull it by individual technician for the last 90 days. Find your spread. Note the highest and lowest producers and the gap between them.
- Run the wage-to-revenue ratio for each tech. Annual salary divided by annual revenue generated. If any technician is above 25%, that is the first gap to diagnose.
- Check your average ticket by technician. A spread of more than $80 between your highest and lowest average ticket producer indicates a pricing or job mix problem.
- Use the marketing cost calculator to see what your current revenue per truck implies about the ROI of additional marketing spend. Adding calls to a low-output fleet costs more per booked job than fixing the output first.
Frequently Asked Questions
How much revenue should an HVAC technician generate per year?
Top-performing HVAC companies generate $180,000 to $280,000 per technician annually. Industry average runs $120,000 to $180,000. The bottom quarter generates $80,000 to $120,000. The benchmark check is the wage-to-revenue ratio: technician wages should represent 14 to 20% of the revenue they generate.
What is the wage-to-revenue ratio for HVAC technicians?
A healthy HVAC operation targets technician wages at 14 to 20% of the revenue that technician generates. A tech earning $52,000 per year should be generating $260,000 to $370,000 in annual revenue. If wages exceed 25% of revenue generated, the technician is either priced wrong, underperforming, or running too low a job mix. Calculate this ratio for each technician individually.
How many jobs per day should an HVAC technician complete?
Three to five jobs per day on service and repair work is the top-performing range per ServiceTitan’s benchmarks. Fewer than 3 jobs per day on standard service calls indicates a dispatch, routing, or job-type problem. Higher-ticket installation days may produce fewer jobs at significantly higher revenue. Judge technicians in installation mode by revenue per day, not job count.
What does it actually cost to roll an HVAC truck?
According to ACCA’s 2025 financial analysis, the average fully-loaded cost to roll an HVAC truck, including wages, benefits, vehicle, insurance, and non-billable drive time, is approximately $84.40 per hour. That is the floor your billing rate and job volume need to clear before generating any margin.
How do I improve average ticket per technician?
Three approaches: implement flat-rate pricing consistently so all techs quote the same job at the same price, train techs to perform a system check on every call and document findings, and route higher-ticket call types to your higher-average-ticket technicians. Most average ticket gaps between technicians are a pricing consistency and call protocol issue, not a competence issue.
When should I add another HVAC truck?
When your existing trucks are running at or above 72% billable utilization consistently, AND you are actively declining or significantly delaying calls, AND your revenue per truck is above $200,000 annually. If any of those three conditions is not met, adding a truck generates new overhead without proportional revenue.
How do I find which technician is dragging down my revenue per truck average?
Pull 90 days of invoiced revenue by assigned technician from your field service platform. Calculate average daily revenue, jobs per day, and average ticket for each technician. Low average ticket with normal job count means a pricing gap. Low job count with normal average ticket means a routing or scheduling problem. Both metrics low means direct observation is needed.
Does revenue per truck include the owner if they are running calls?
Only if you want an accurate picture of your business’s scalable capacity. For capacity planning and hiring decisions, calculate revenue per truck using only your employed technicians. Owner revenue can be tracked separately but should not be used to inflate the team benchmark. It creates a false picture of what your fleet produces without you in it.